Figure 1.
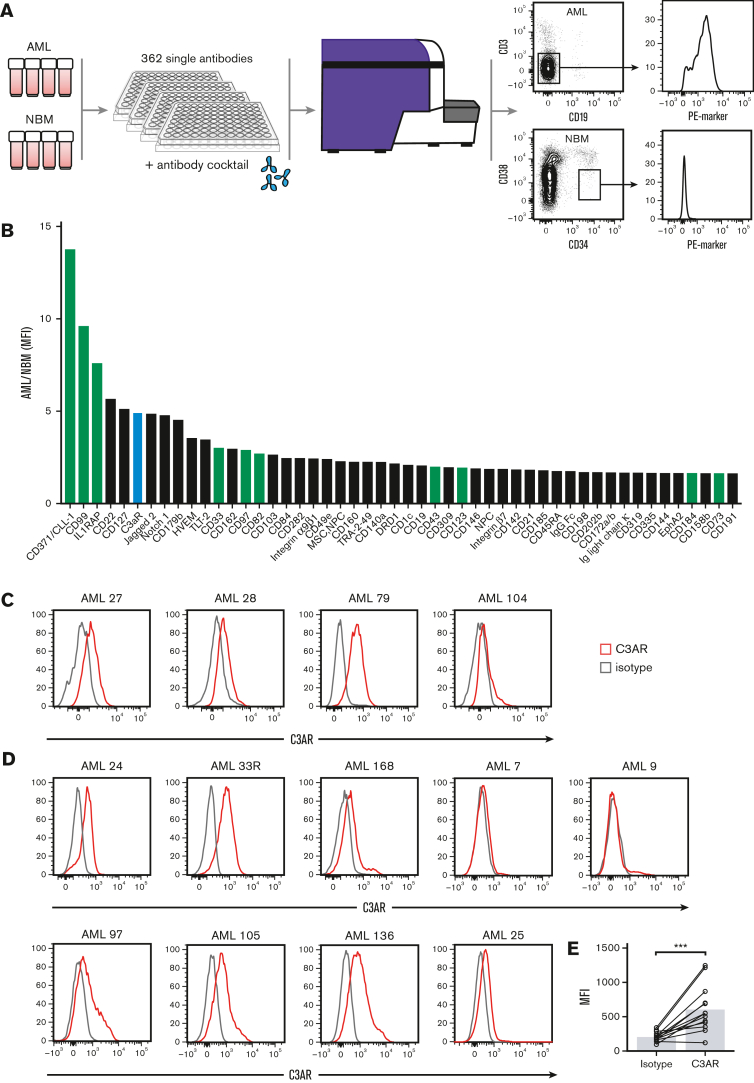
Antibody-based screening identifies cell surface markers specifically upregulated on NPM1-mutated AML cells. (A) Schematic illustration showing the arrayed antibody screen performed on CD3− CD19− myeloid-enriched blasts from NPM1-mutated AML samples and CD34+ CD38low stem cell–enriched NBM samples. The antibody library contained 362 PE-marked antibodies. In total, 4 primary AML samples and 4 NBM samples were used in the screen. (B) Screening results showing the top-ranked cell surface markers in AML compared with NBM cells, calculated as the ratio of the median MFI of the CD3− CD19− AML cells over the median MFI of the NBM CD34+CD38low cells for each marker. The green bars illustrate known LSC markers, the lavender bars illustrate novel markers, and the red bar shows C3AR that was chosen for further investigation. (C) Expression of C3AR in the primary NPM1-mutated samples used in the screen. (D) Validation of C3AR expression in 9 additional NPM1-mutated AML samples. C3AR stain in red and isotype control in gray. (E) MFI of C3AR in all NPM1-mutated AML samples (n = 13), compared with isotype control. ∗∗∗P ≤ .001 in a Wilcoxon nonparametric paired test. MFI, median fluorescence intensity.

