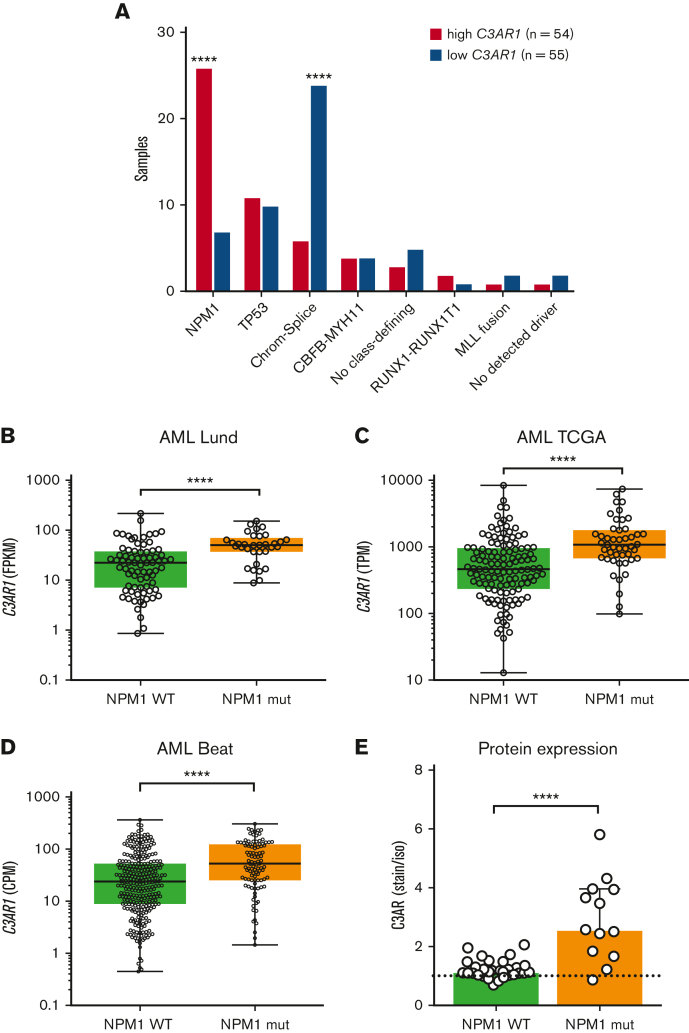
Figure 3.
C3AR1 is specifically upregulated in NPM1-mutated AML cells. (A) Number of cases with high vs low C3AR1 mRNA expression in each genetic subgroup in a cohort of AML samples (n = 109) diagnosed and analyzed by RNA-seq in Lund, Sweden. AML subgroups with <3 patients were excluded from the analysis. High C3AR1 in magenta and low C3AR1 in purple. (B) FPKM values for C3AR1 in NPM1-mutated cases vs cases with NPM1 WT in the entire AML Lund cohort (n = 112). (C) TPM values for C3AR1 in NPM1-mutated cases vs cases with NPM1 WT, in the publicly available TCGA AML data set (n = 173). (D) CPM values of C3AR1 in NPM1-mutated cases vs cases with NPM1 WT, in the Beat AML data set (n = 400). C3AR1 expression in panels B-D are represented as box plots. (E) C3AR protein expression calculated as fold change of C3AR MFI over isotype control MFI in NPM1-mutated AML cases and NPM1 WT cases, analyzed by flow cytometry, in the CD3− CD19− myeloid-enriched compartment (n = 43). Bars show median with interquartile range. ∗∗∗∗P ≤ .0001 using a Fisher exact test in panel A. ∗∗∗∗P ≤ .0001 using a nonparametric Mann-Whitney U test in panels B-E. Chrom-splice, chromatin-spliceosome; CPM, counts per million mapped reads; FPKM, fragments per kilobase of exon model per million reads mapped; MFI, median fluorescence intensity; mRNA, messenger RNA; TCGA, The Cancer Genome Atlas; TPM, transcripts per million.

