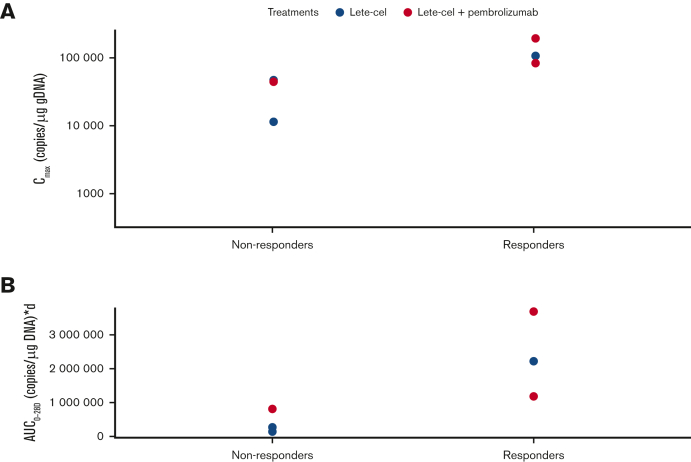
Figure 3.
T-cell expansion and exposure. (A) T-cell expansion (Cmax) in responders (patients who achieved a ≥PR per IMWG Uniform Response Criteria 2016) and nonresponders. (B) T-cell exposure shown (AUC0-28d) in responders vs nonresponders. AUC0-28d, area under the curve from day 0 to day 28; Cmax, peak T-cell expansion; gDNA, genomic DNA; IMWG, International Myeloma Working Group.

