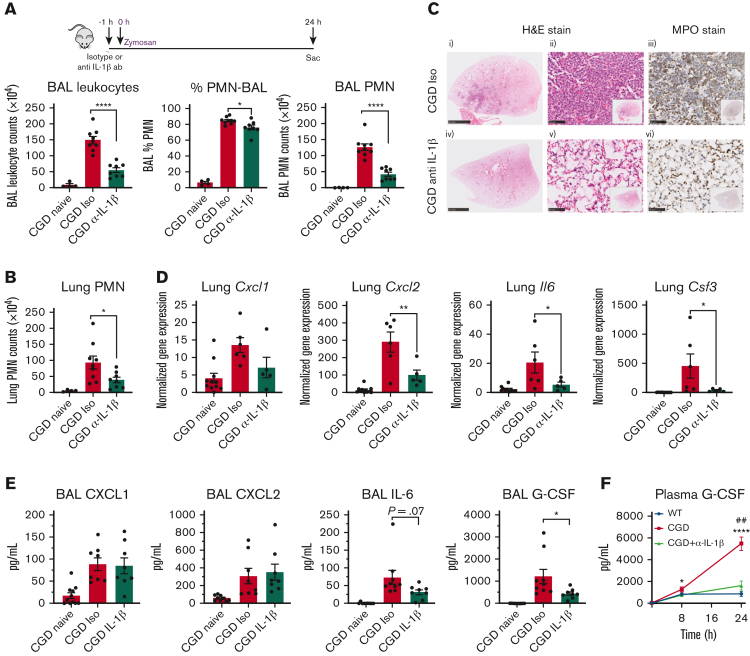
Figure 2.
IL-1β neutralization reduces zymosan-induced lung inflammation and G-CSF level in BAL in CGD mice at 24 hours. (A-B) CGD mice were injected intraperitoneally with anti–IL-1β antibody or isotype, followed by intranasal instillation of 20 μg zymosan after 1 hour. BAL and lung tissue collected at 24 hours after zymosan challenge. (A) Total leukocyte counts from 3 mL BAL fluid. The percentage of neutrophils were identified by cytospin. BAL PMN counts were calculated from cytospin results. (B) PMN (CD45+CD11b+Ly6G+) counts from right lung inferior lobe were calculated by flow cytometry. Panels A and B, n ≥ 4 from >2 independent experiments. Data are means ± SEM. ∗P < .05, ∗∗∗∗P < .001, by one-way ANOVA. (C) Formalin-fixed, paraffin-embedded lung sections were stained with hematoxylin and eosin or processed for immunohistochemical staining with MPO. Scale bar, 2.5 mm for (i) and (iv) and 50 μm for (ii), (iii), (v), and (vi). (D) Gene expression level of Cxcl1, Cxcl2, Il6, and Csf3 from lung tissue were determined by qPCR. n ≥ 5 from 2 independent experiments. Data are means ± SEM. ∗P < .05, ∗∗P < .01, by one-way ANOVA. (E) CXCL1, CXCL2, IL-6, and G-CSF levels in first milliliter of BAL were determined by ELISA. n ≥ 8 from >3 independent experiments. Data are means ± SEM. ∗P < .05, by one-way ANOVA. (F) G-CSF level in plasma was determined by ELISA. n ≥ 5 from >3 independent experiments. Data are means ± SEM. ∗P < .05; ∗∗∗∗P < .0001, ##P < .01; by Student t test; ∗ indicates comparison between WT and CGD groups, # indicates comparison between CGD and CGD α-IL-1β antibody groups. qPCR, quantitative polymerase chain reaction; SEM, standard error of the mean.

