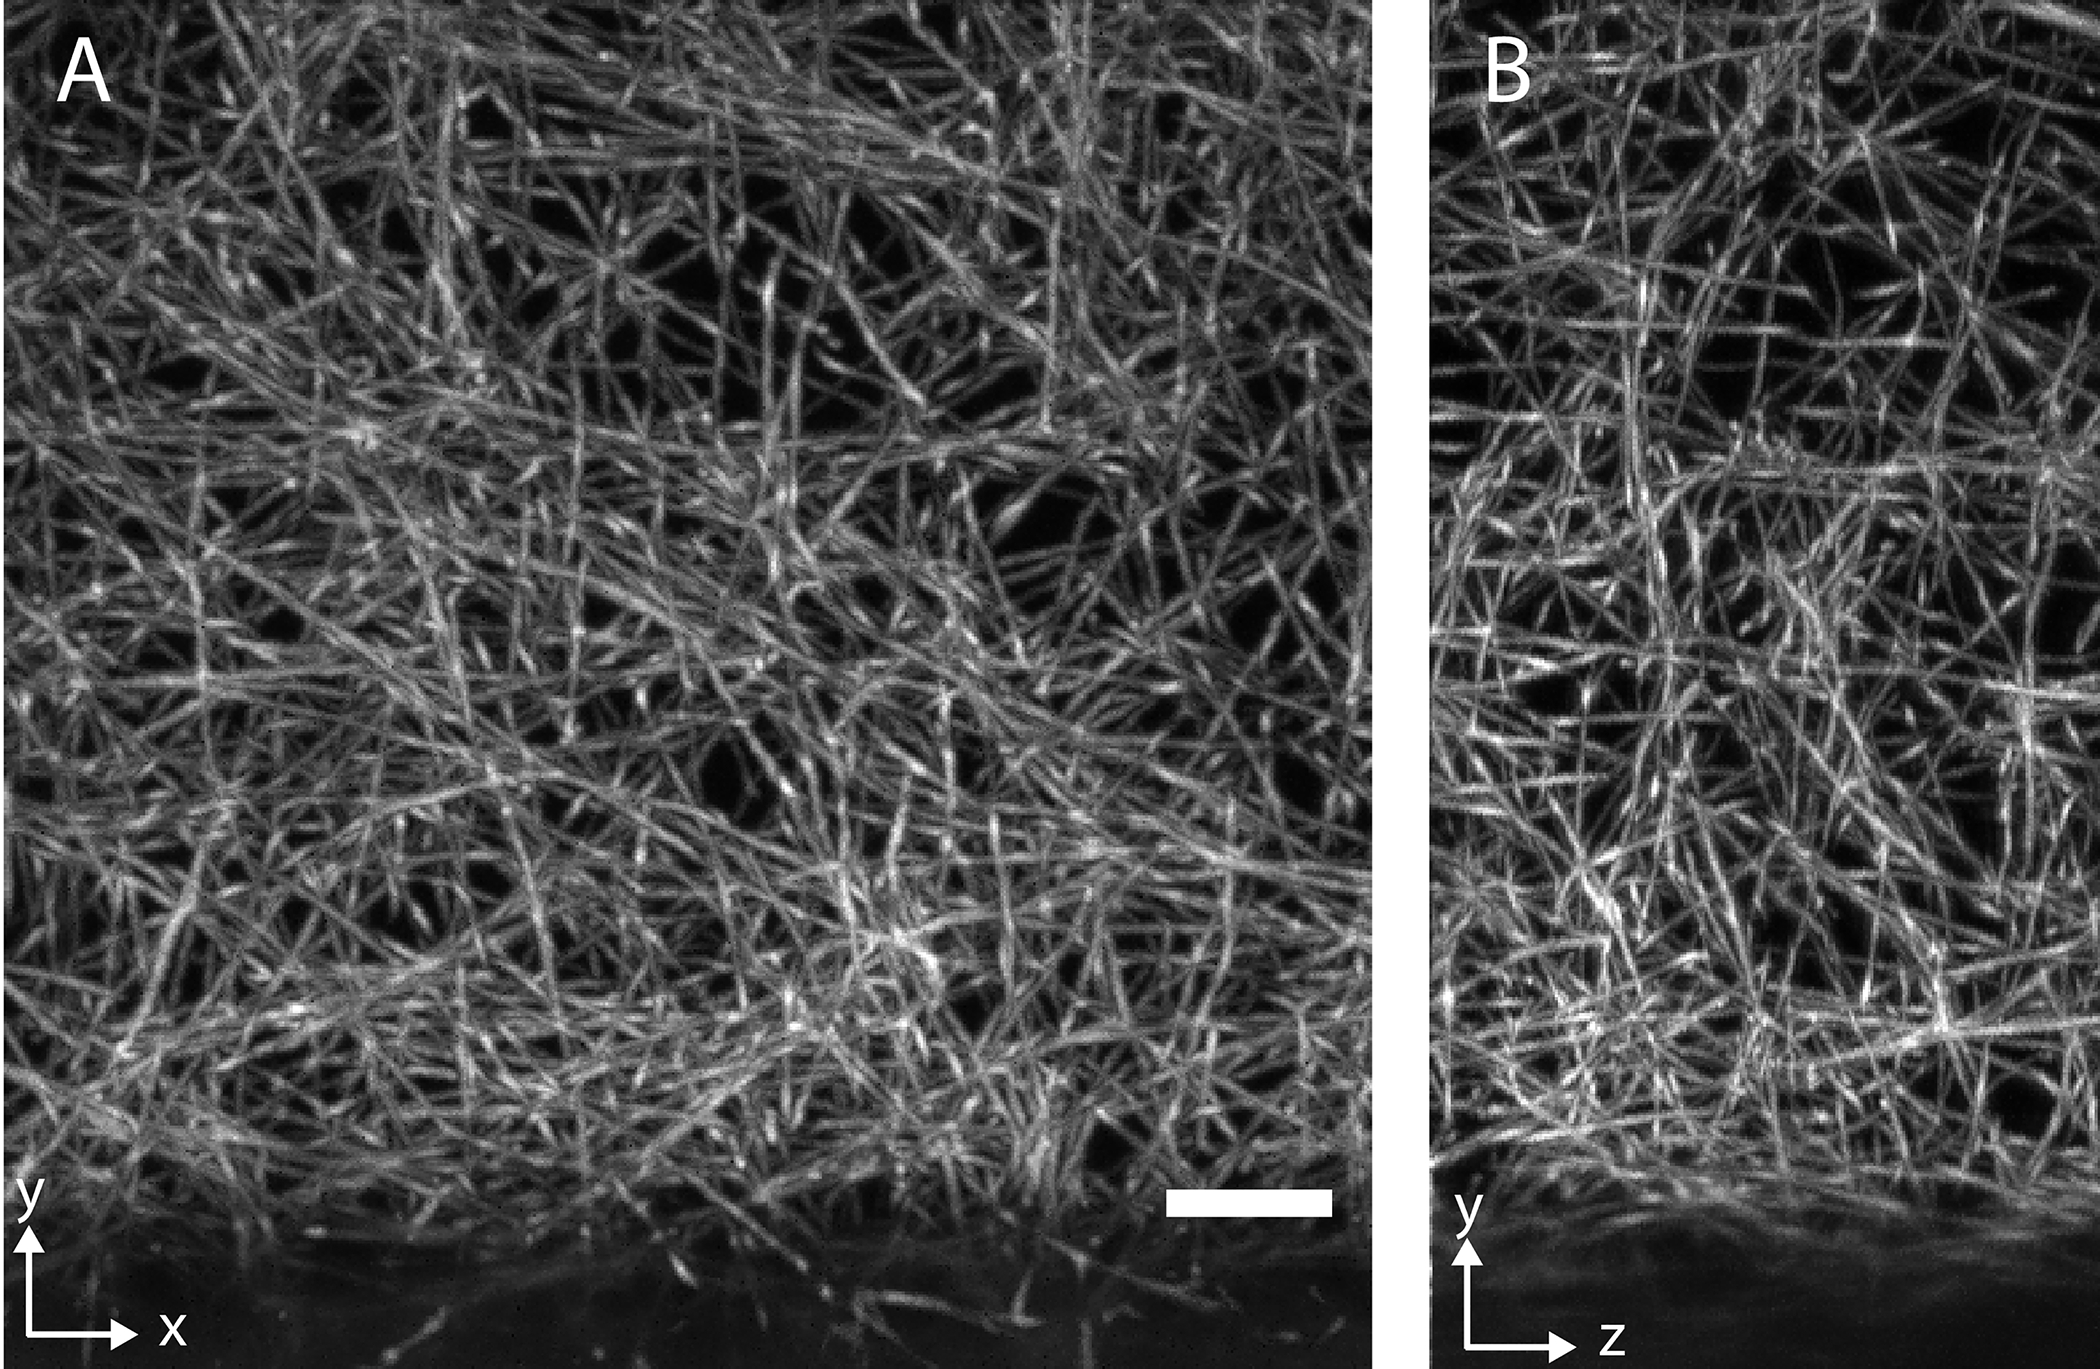
Figure 14. ASLM imaging of a fluorescent collagen sample.

a, XY maximum intensity projection. b, YZ maximum intensity projection. The excitation and detection numerical aperture were 0.8. Collagen was covalently labeled with an Alexa Fluor 568 NHS ester prior to polymerization, as described elsewhere.52 Scale bar: 10 microns.
