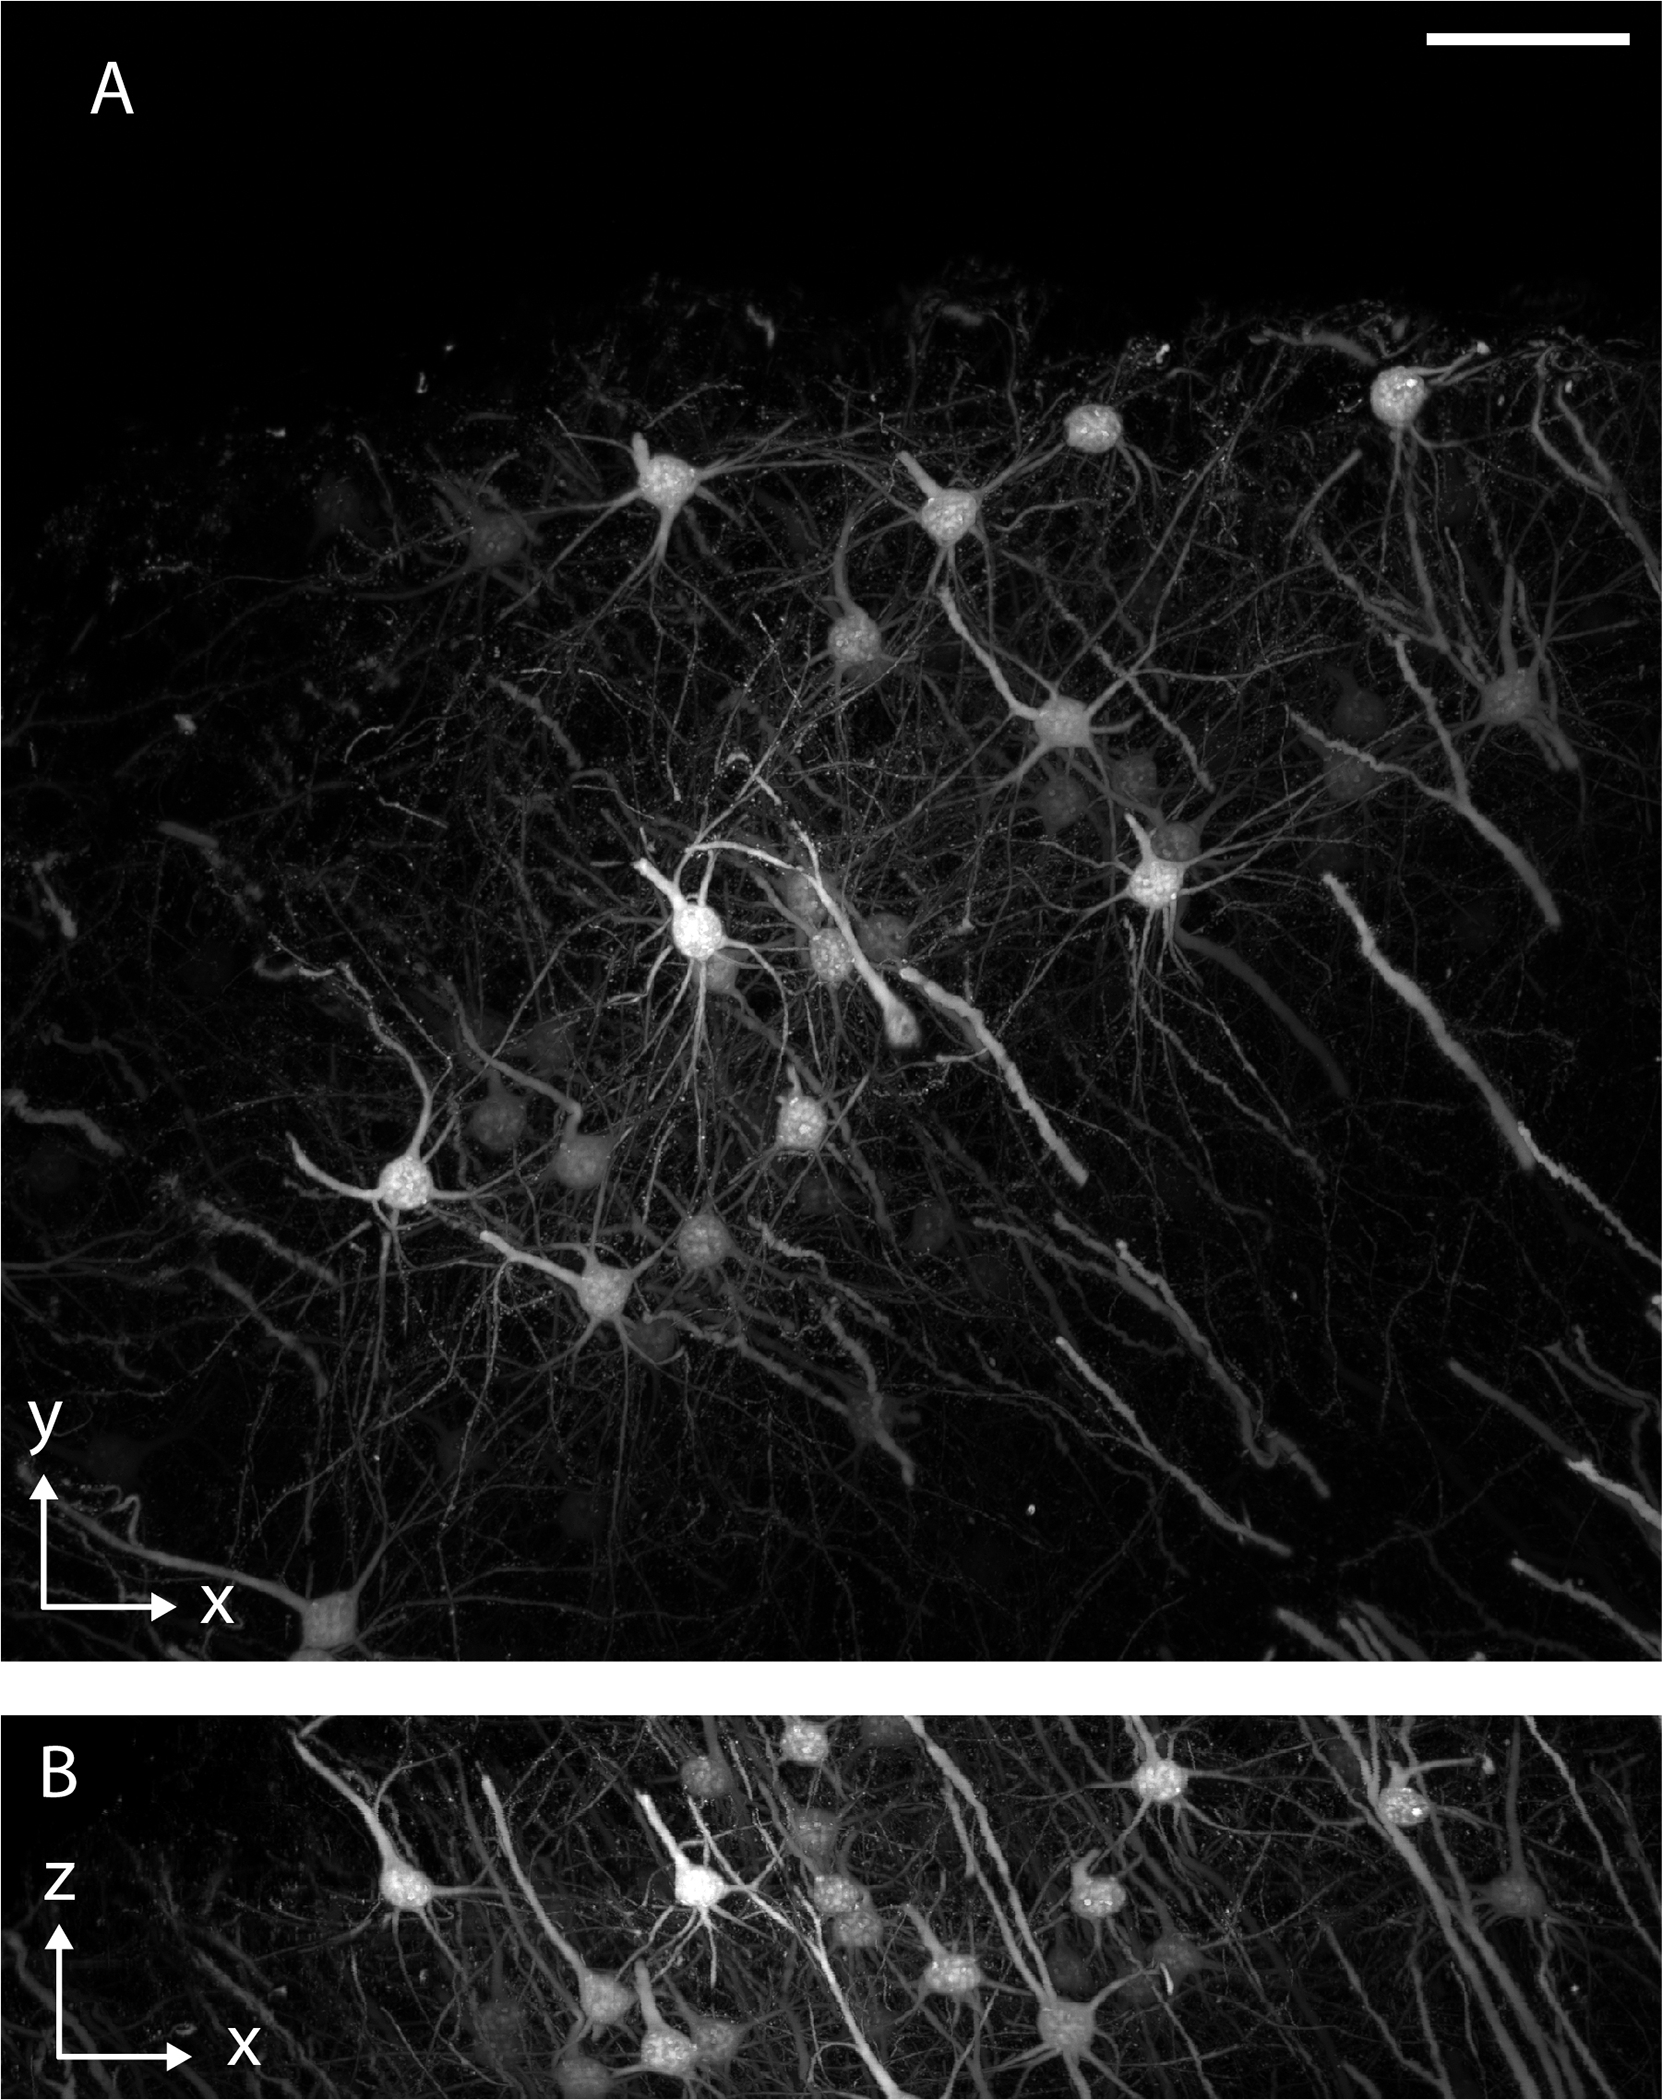
Figure 15. ASLM imaging of a cleared mouse brain sample.

ASLM imaging in a PEGASOS cleared mouse brain labeled with THY1-eGFP. a, XY view shown as a maximum intensity projection of the volume. b, An XZ view shown as maximum intensity projection of the volume. The numerical aperture of excitation and detection was 0.4. Scale bar 100 microns
