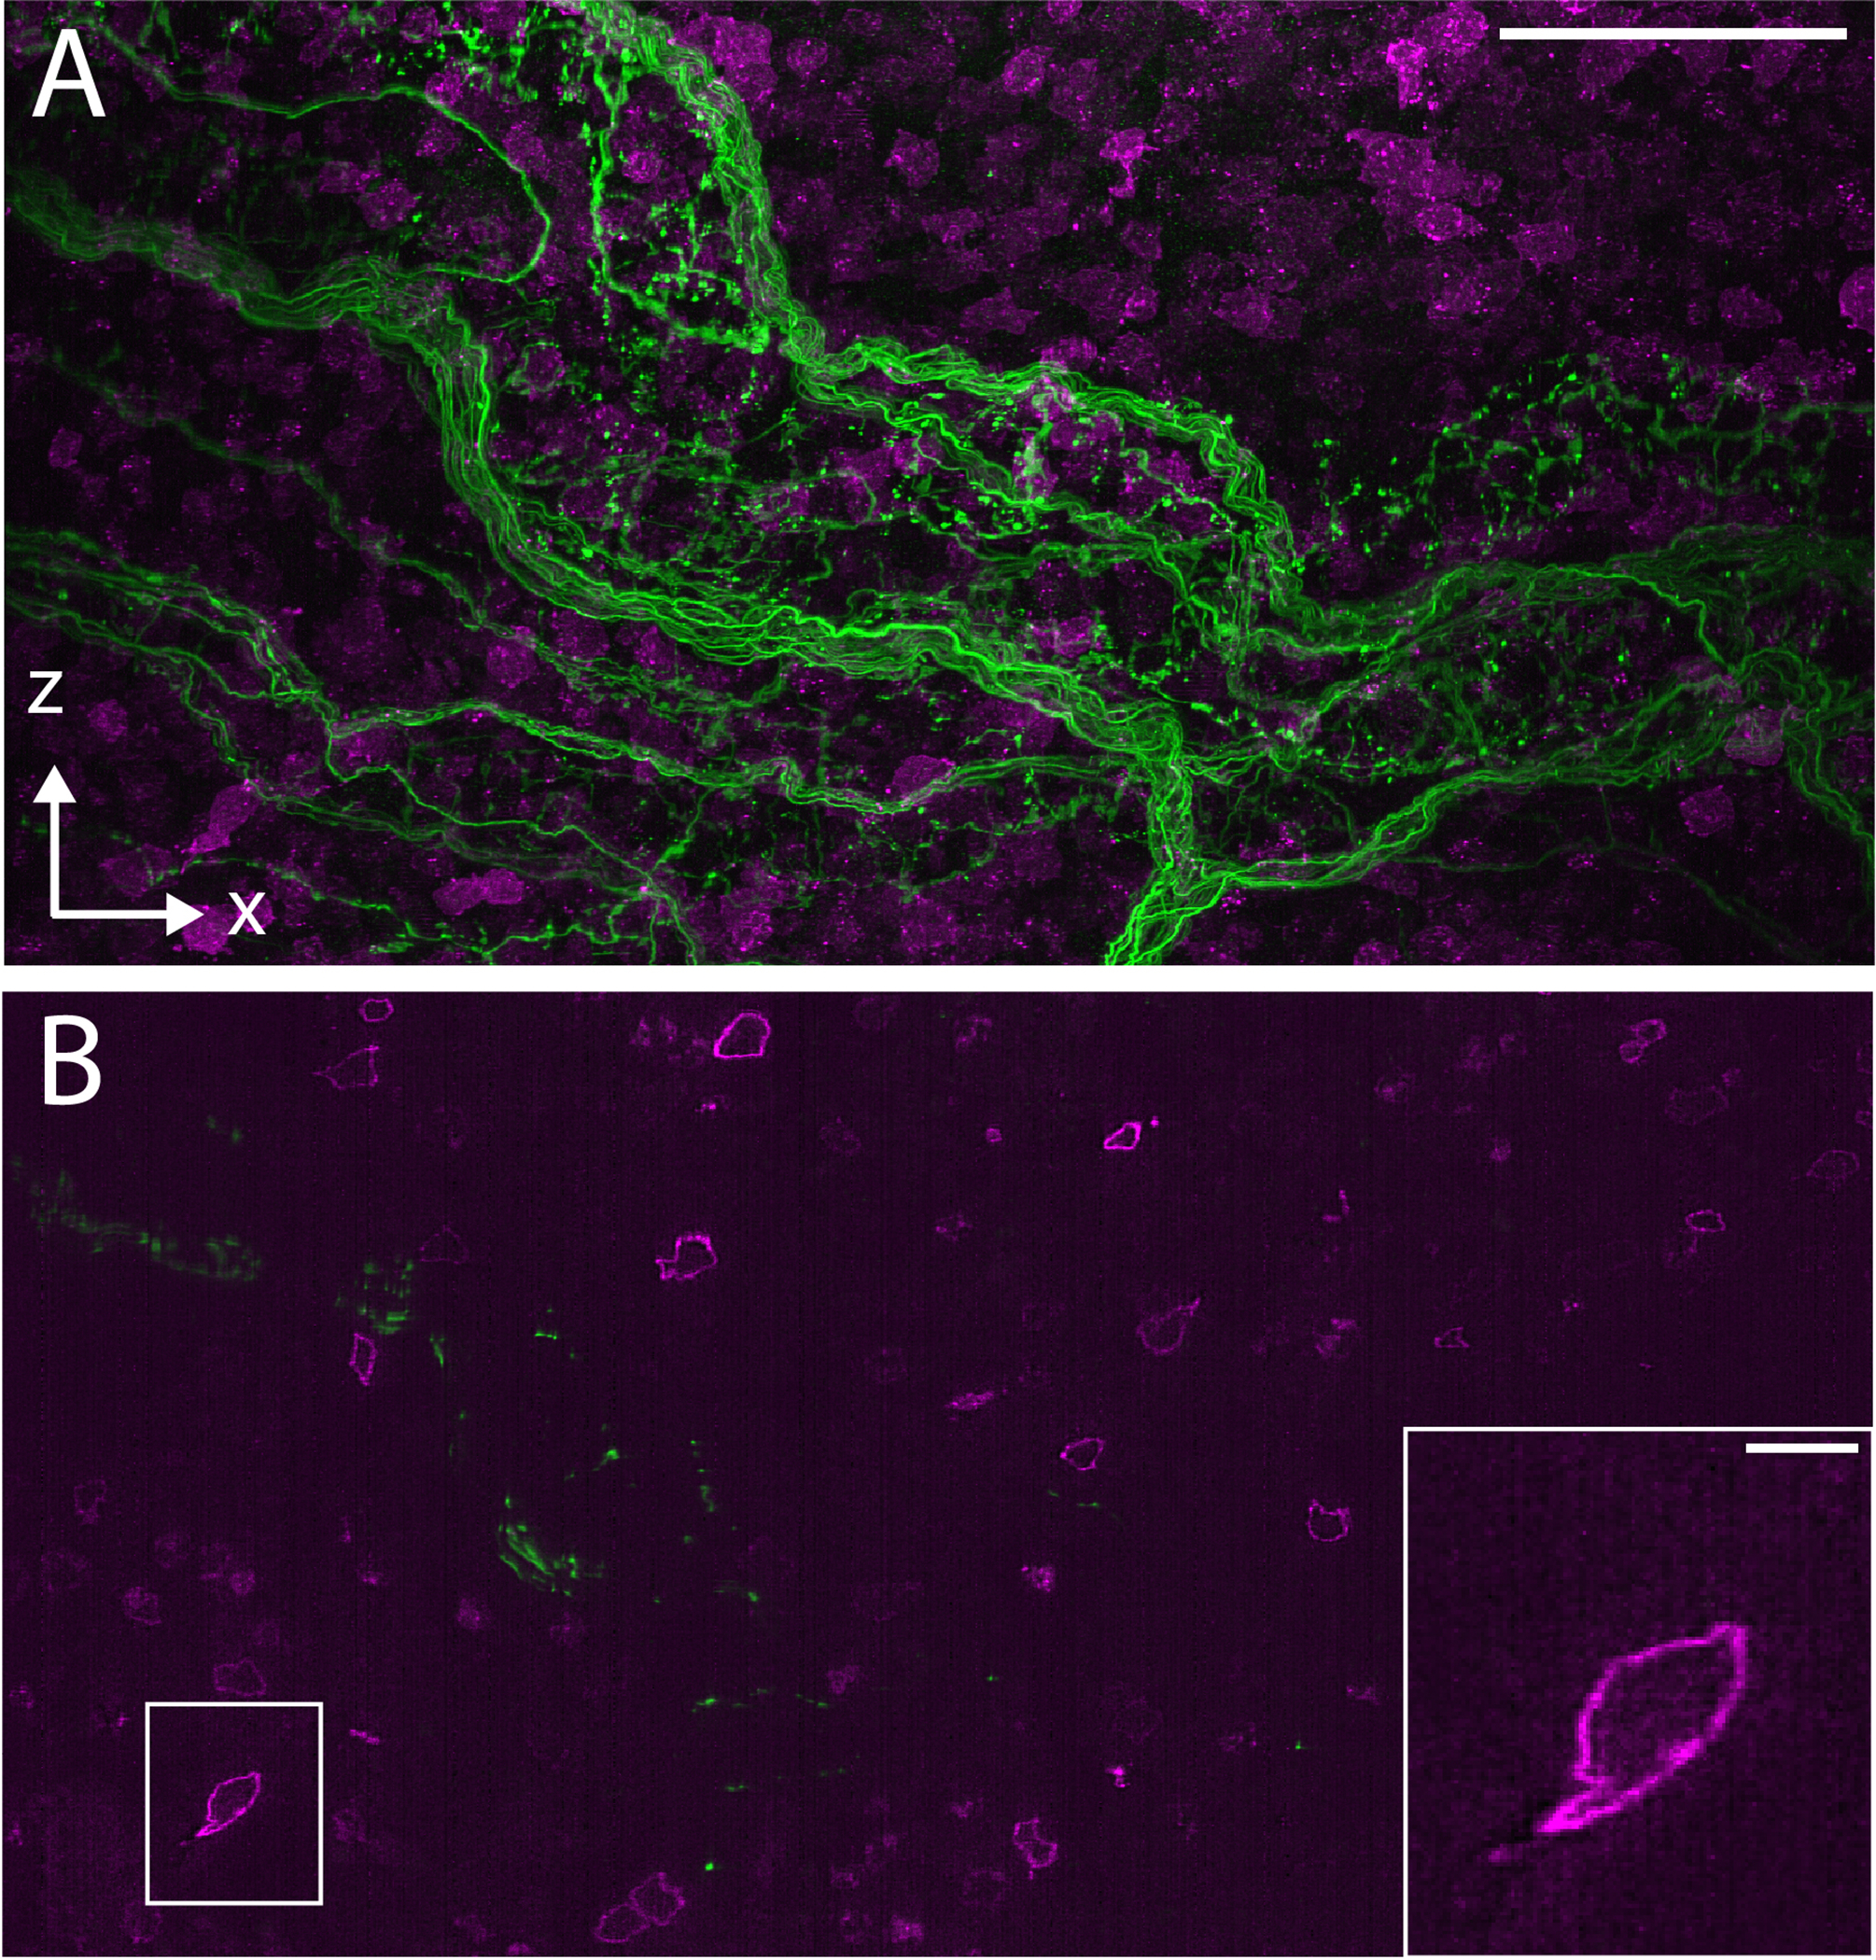
Figure 16. ASLM imaging in a BABB cleared mouse bone marrow sample.

a, XZ Maximum intensity projection of the image volume. b, Single XZ slice. The inset shows a magnified version of the boxed region on the left. Nerve fibers are labelled with Alexa 488 (shown in green) and c-Kit+ stem/progenitor cells are labeled with Alexa 647 (shown in magenta). The numerical aperture for excitation and detection was 0.7. Scale bars: a, 50 microns. b, inset: 5 microns.
