
Figure 1. Genetic correlation and the influence of shared genetic burden of cardiometabolic traits and health conditions unique to women.
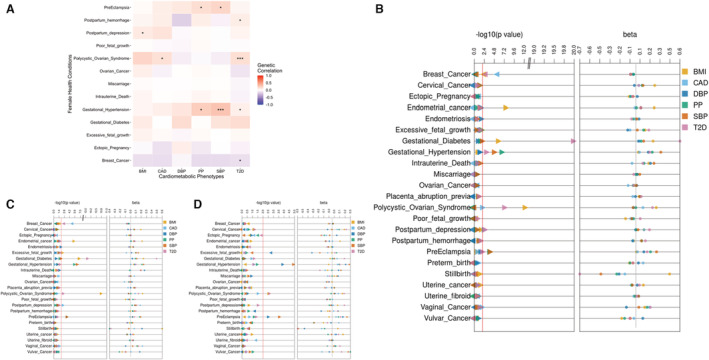
A, Heatmap of genetic correlations between cardiometabolic phenotypes and female‐specific health conditions using multiancestry cardiometabolic genome‐wide association studies (GWASs) and European and African ancestry meta‐analyzed GWASs for female‐specific health conditions. Blue represents negative correlation and red represents positive correlation. Triple asterisks in a box indicate false discovery rate significance, and a single asterisk in a box indicates nominal significance (P<0.05). Genetic correlation was unable to be calculated for grayed‐out boxes. B through D, Results of polygenic score (PGS)‐based meta‐analyses between cardiometabolic PGSs and case–control status of female‐specific health conditions overall (B) and in participants of European (C) and African (D) ancestry. The first panel in these plots corresponds to raw, unadjusted P values, and the second panel shows β estimates. The color of each point refers to the PGS for cardiometabolic traits. The red line corresponds to the P=0.01 threshold. BMI indicates body mass index, CAD, coronary artery disease; DBP, diastolic blood pressure; PP; pulse pressure; SBP, systolic blood pressure; and T2D, type 2 diabetes.