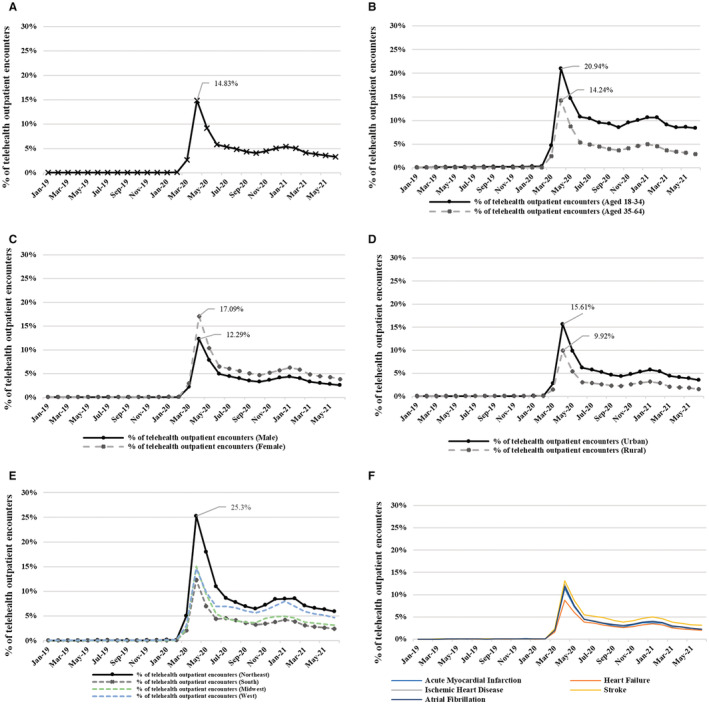
Figure 3. The proportion of telehealth outpatient encounters among patients with CVD by all subgroups: age, sex, urbanicity, Census region, and sub‐CVD disease during January 2019 to June 2021 using the MarketScan Commercial Claims and Encounters database.

A, All samples. B, By age group. C, By sex. D, By urbanicity. E, By Census region. F, By sub‐CVD disease. On the y‐axis, we report the percent of telehealth outpatient encounters among patients with CVD (ie, the total number of telehealth outpatient encounters divided by the total number of outpatient encounters, then multiplied by 100). Out of 474 811 patients with CVD (Figure 1), 35 863 patients were aged 18 to 34 y, and 426 428 were aged 35 to 64 y; 234 107 patients were men, and 240 704 were women; 410 911 patients lived in urban regions, and 63 900 lived in rural regions; 72 859 patients lived in the Northeast; 244 384 patients lived in the South; 109 464 patients lived in the Midwest; and 47 176 patients lived in the West. There were 12 571 patients with acute myocardial infarction, 20 327 patients with heart failure, 81 082 patients with ischemic heart disease, 28 395 patients with all strokes, and 32 599 patients with atrial fibrillation. For both telehealth and in‐person outpatient encounters, the differences in the monthly estimates of the numbers per 100 patients with CVD between subgroups of age, sex, and urbanicity were tested using a Welch 2‐tailed t test, and the differences among subgroups of Census region and sub‐CVD diseases were tested using 1‐way ANOVA by each month to test the differences in the monthly estimates by subgroups. The test results are shown in Table S3. CVD indicates cardiovascular disease.
