
Figure 1. Heat maps of correlation between markers of mitochondrial quality control in gastrocnemius muscle samples and measures of physical performance in participants with and without peripheral artery disease.
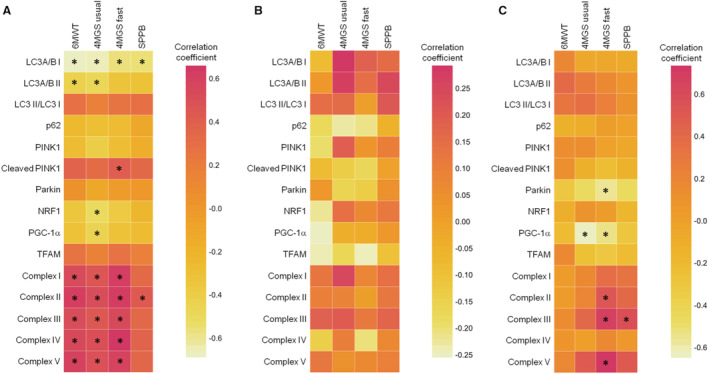
A, Participants without peripheral artery disease (PAD); B, participants with mild PAD (ankle‐brachial index, ABI 0.60–0.90); C, participants with moderate to severe PAD (ABI <0.60). *P<0.05. 4MGS fast indicates 4‐m gait speed at fast pace; 4MGS usual, 4‐m gait speed at usual pace; 6MWT, 6‐minute walking test; LC3B, microtubule‐associated protein 1A/1B‐light chain 3 nonlipidated (I), and lipidated (II) forms; NRF1, nuclear respiratory factor 1; PGC‐1α, peroxisome proliferator‐activated receptor gamma coactivator 1 alpha; PINK1, phosphatase and tensin homolog‐induced kinase 1; SPPB, short physical performance battery; and TFAM, mitochondrial transcription factor A.