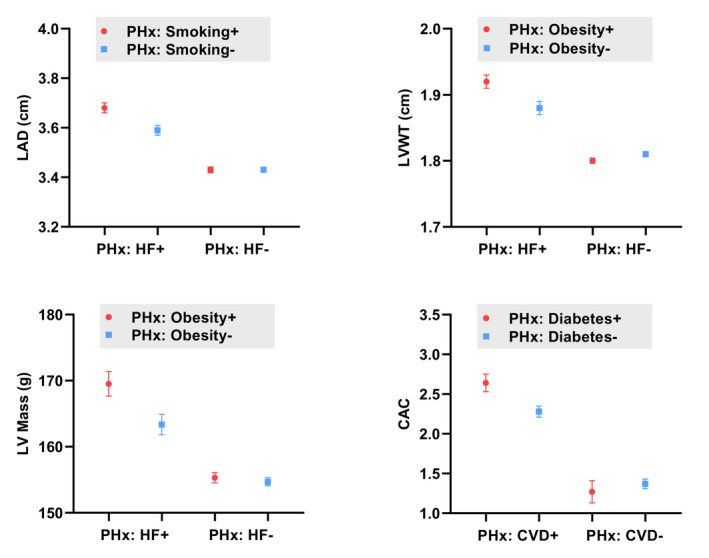
Figure 2. Parental history of HF and CVD, and association with cardiac structure and function in offspring.

Point estimates represent adjusted means of LAD, LV mass, LVWT, and natural log‐transformed CAC, with error bars representing SE. Stratified by 4 groups based on parental history. Means adjusted for age, sex, cohort, systolic blood pressure, hypertension treatment, body mass index, diabetes, smoking status, and total cholesterol/high‐density lipoprotein ratio. CAC indicates coronary artery calcification; CVD, cardiovascular disease; HF, heart failure; LAD, left atrial diameter; LV Mass, left ventricular mass; LVWT, left ventricular wall thickness; and PHx, parental history.
