
Figure 1. Example of an echocardiographic image of a parasternal short‐axis view.
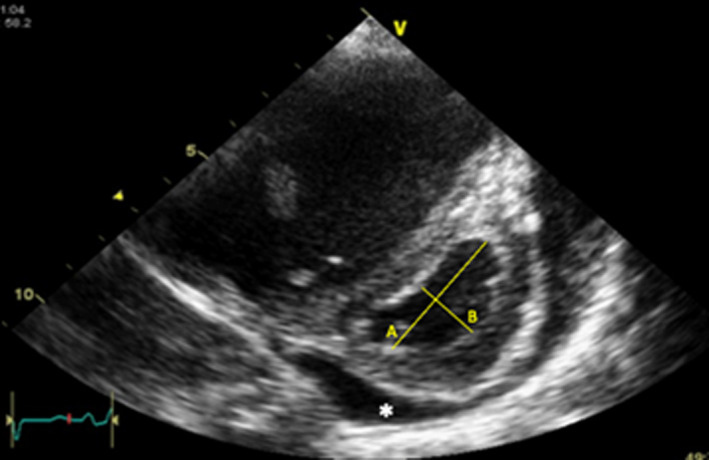
The figure illustrates how left ventricular eccentricity index (LVEI) can be derived from 2‐dimensional imaging. LVEI is expressed as the ratio of A/B. Ratio can be measured in systole or diastole. In addition, there is a small amount of pericardial effusion (*) visible around the left ventricle.