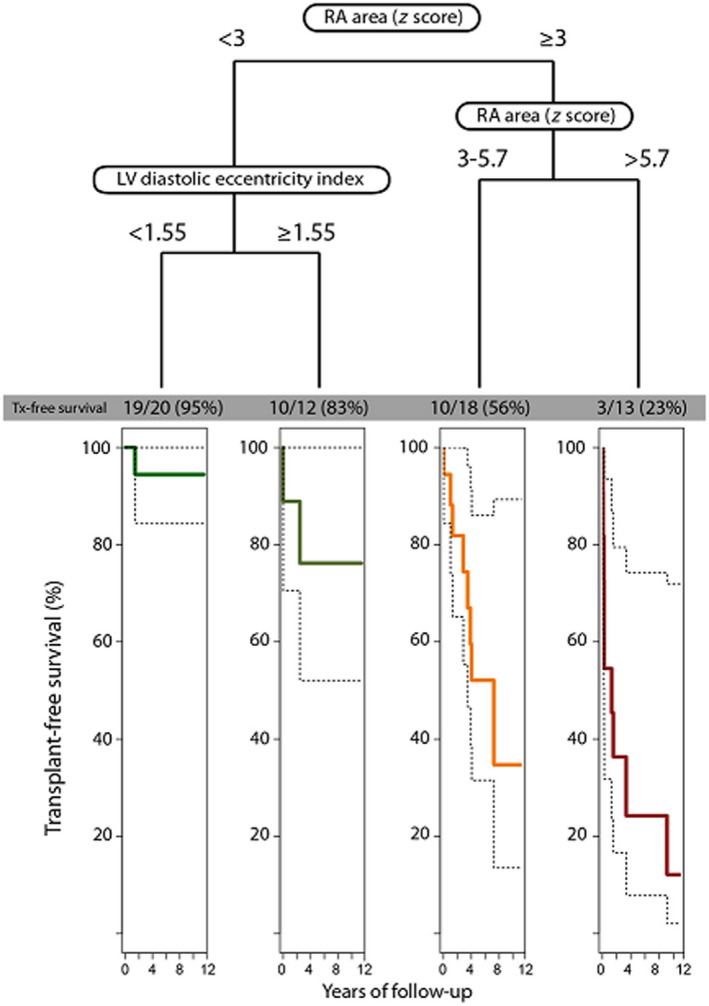
Figure 3. Risk stratification based on the results of the survival tree models using recursive partitioning for classification.

Patients are stratified into 4 risk groups based on baseline right atrial (RA) area z score and left ventricular (LV) diastolic eccentricity index. The Kaplan‐Meier curves illustrate the transplant‐free survival prospects of each group, respectively. Tx indicates transplant.
