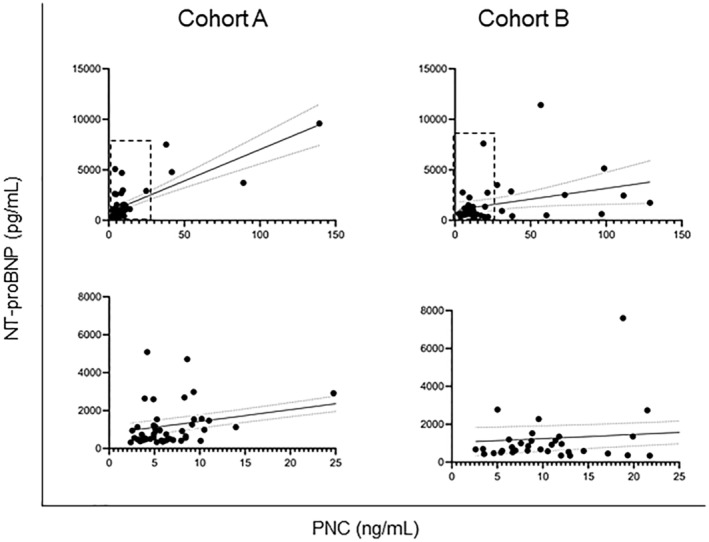
Figure 3. PNC values correlate to NT‐proBNP values.

(Top) Simple linear regression was used to determine a correlation between PNC levels and NT‐proBNP levels in each cohort. A modest correlation is observed in cohort A (n=51; slope, 62.16; r 2=0.56; slope, non‐0; P<0.0001), and a slight correlation is found in cohort B (n=44; slope, 21.41; r 2=0.10; slope, non‐0; P=0.0326). (Bottom) Inset of hashed area of top graphs. NT‐proBNP indicates N‐terminal pro‐B‐type natriuretic peptide; and PNC, precursor pro‐N‐cadherin.
