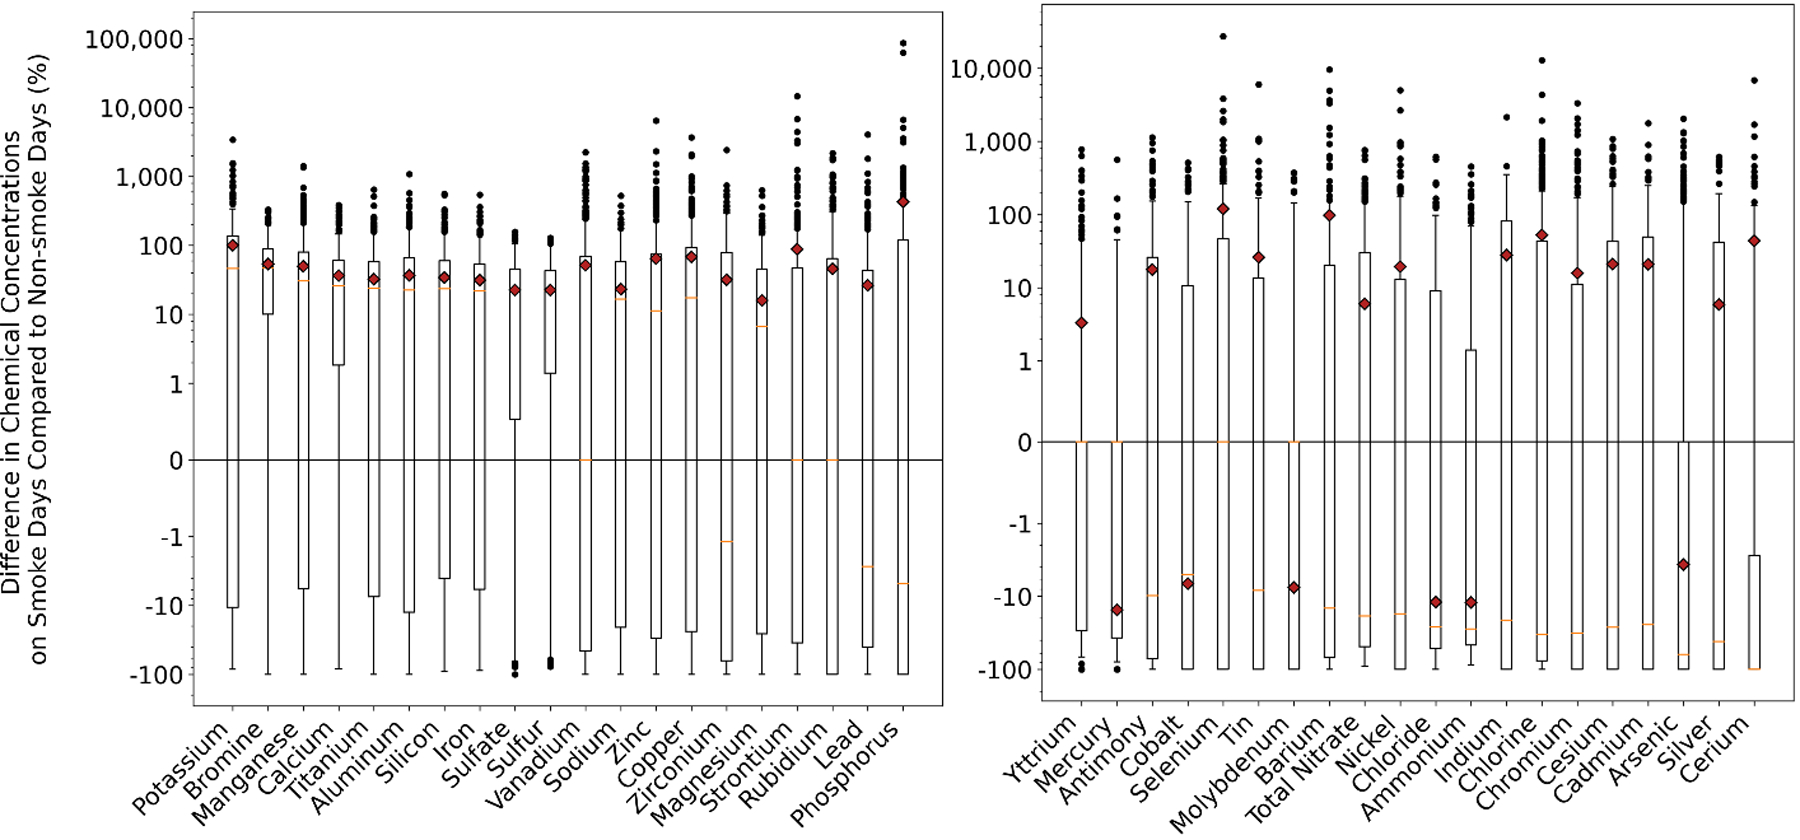
Fig. 2.

Percent differences in chemical concentrations on smoke days compared to non-smoke days at each monitoring station, for each chemical, across all years (2006–2018). Each black dot represents a single monitoring station for one year. The red diamonds are the average values across all stations, all years. The red horizonal lines are the median values across all monitoring stations, all years.
