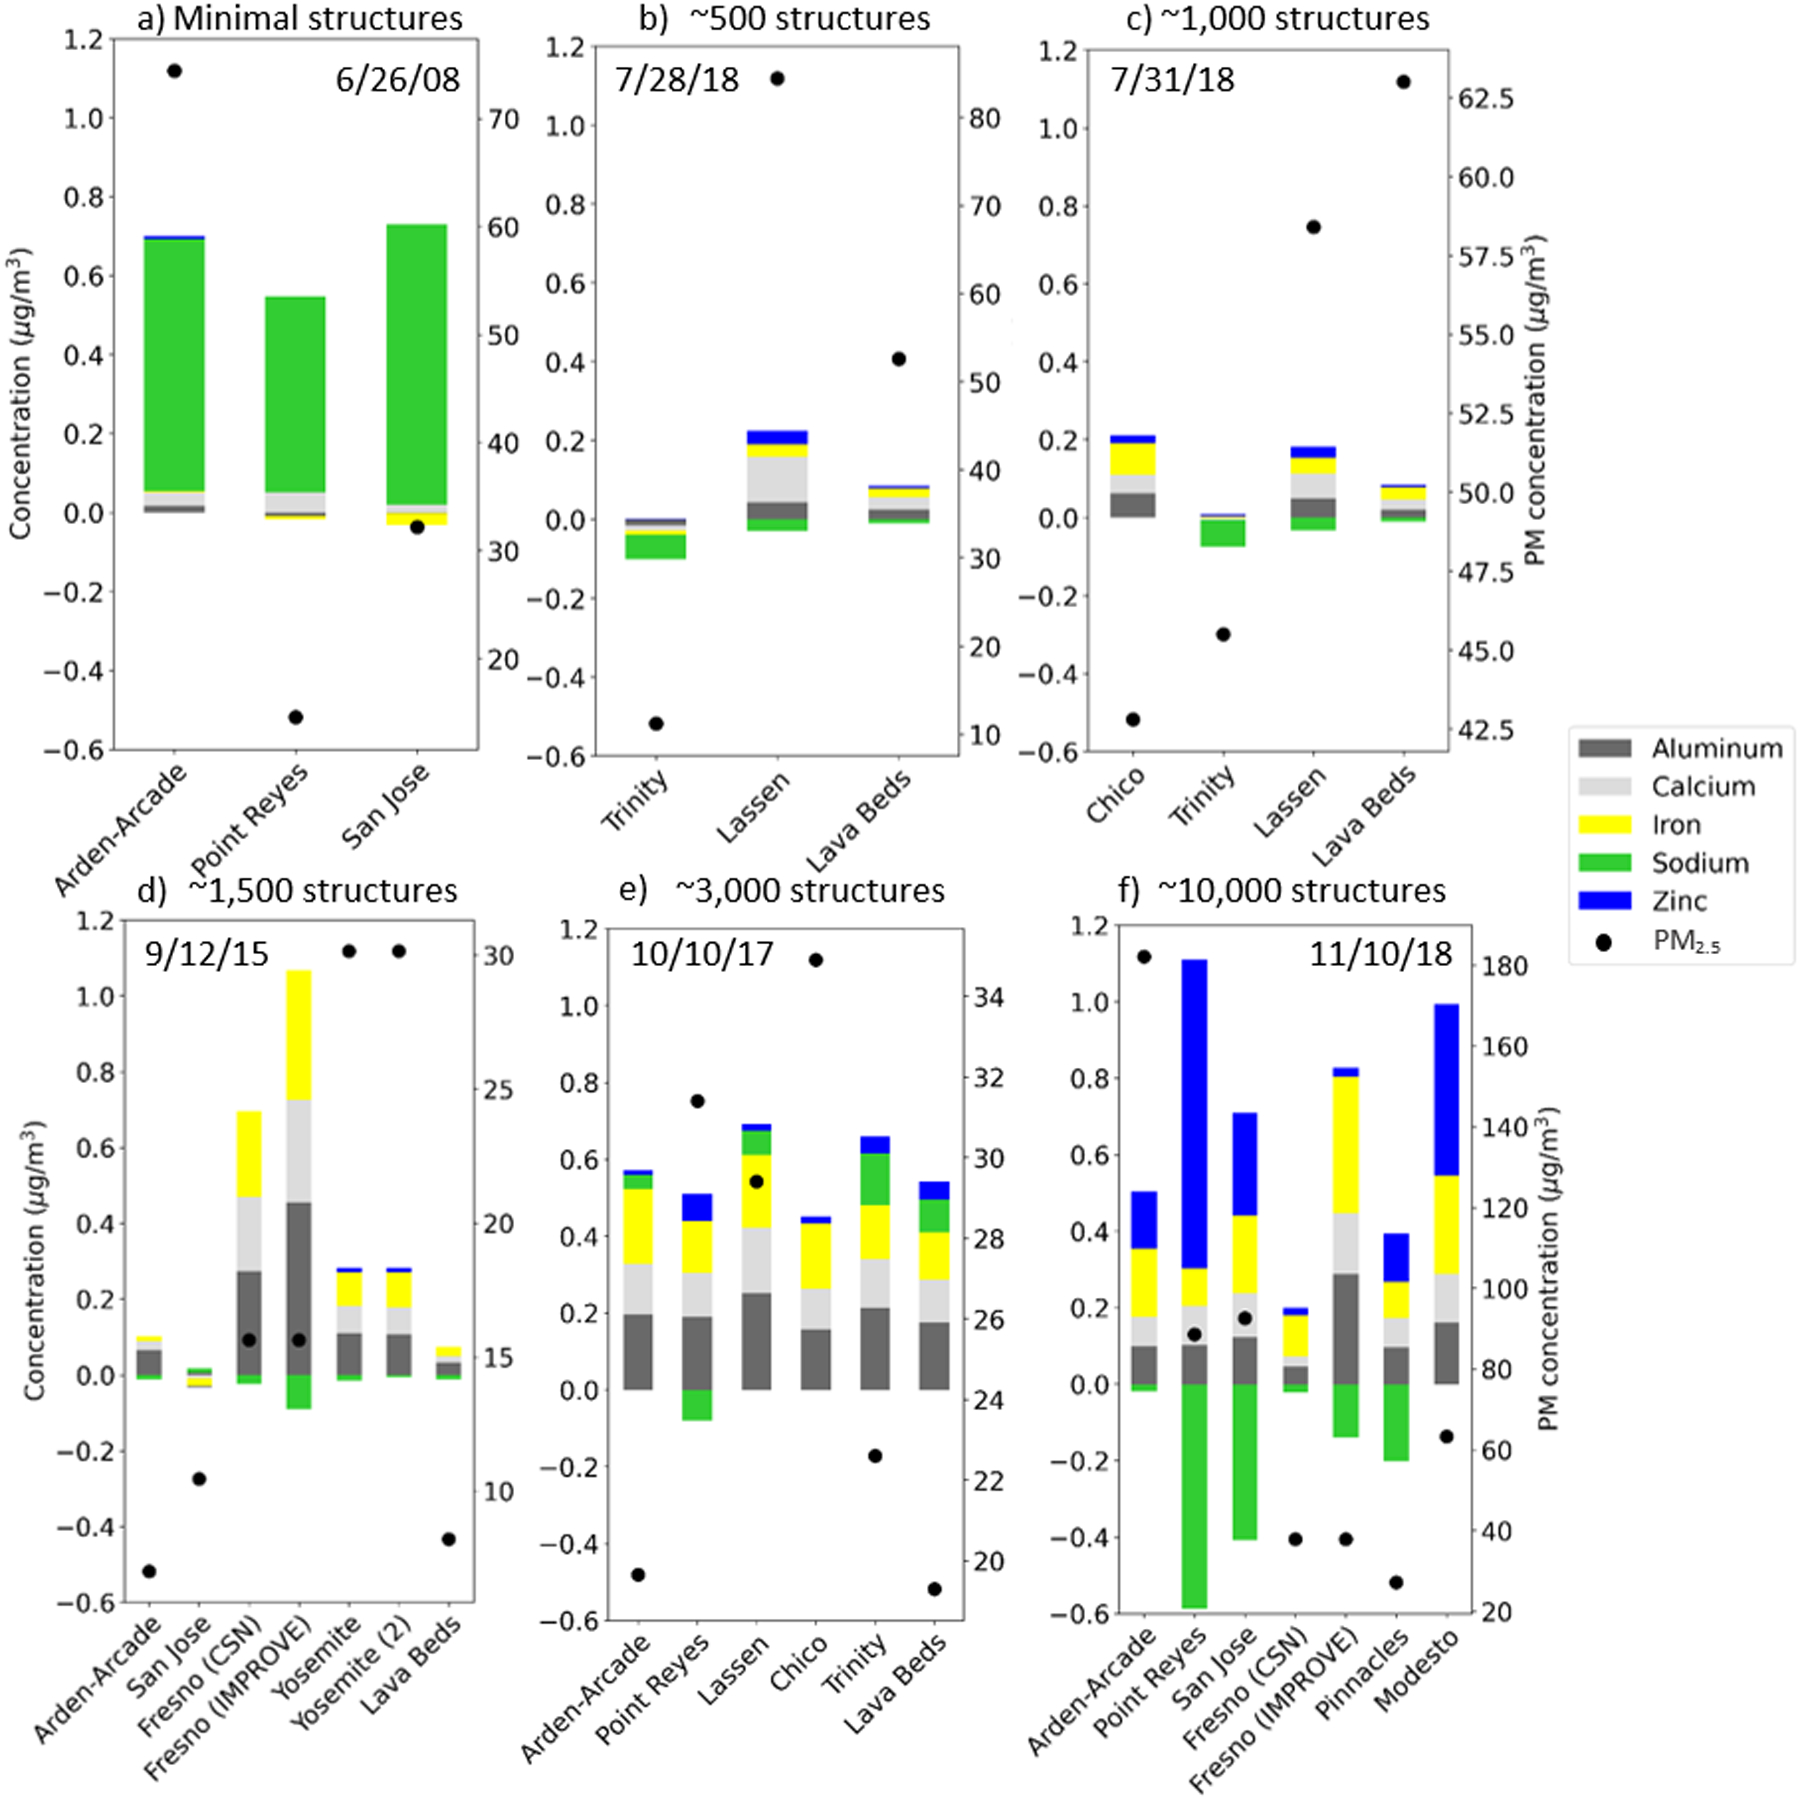
Fig. 4.

Chemical concentrations (in ug/m3) at smoke-impacted monitoring stations for six fire events in California: June 2008 Fires (a), the Carr Fire (b and c), the 2015 September Fires (Valley and Butte) (d), the October 2017 Fires (Tubbs, Atlas, Nuns, and Redwood Complex) (e), and the Camp Fire (f). Presented are the concentrations measured at each monitor on the fire event date noted in each panel minus the non-smoke day average concentration for each chemical at the corresponding station and year (April 1st through December 31st). Values are negative where the fire event concentration was exceeded by the corresponding non-smoke day average. Structures listed are approximate structures burned at time of measurement. The black dots are total PM2.5 concentration (in ug/m3) at each monitoring station.
