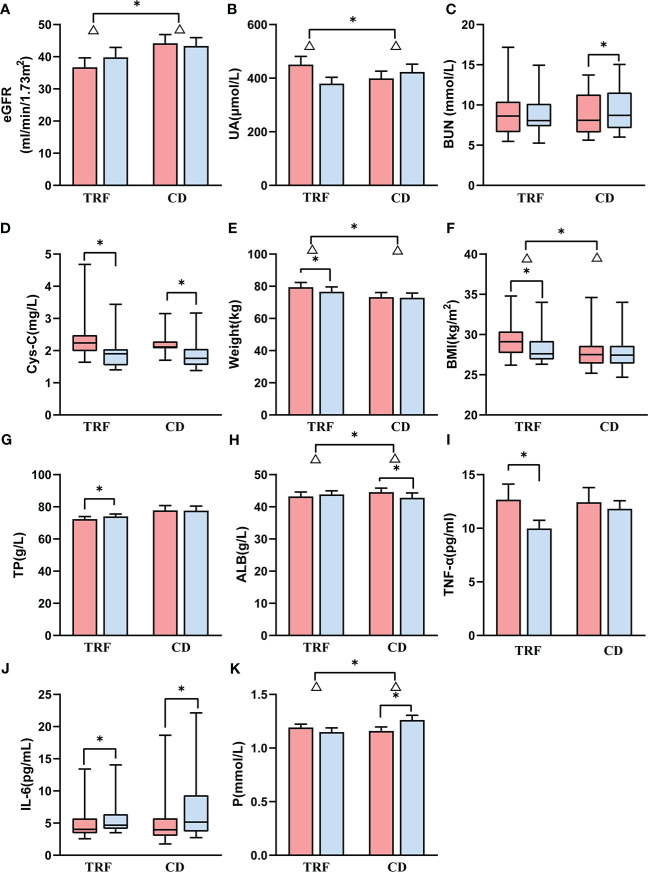
Figure 1.
Comparison of renal function and other biochemical parameters between groups. Data following a normal distribution are presented as error bar plots; data not following a normal dis-tribution are presented as box-and-whisker plots. Red represents before intervention, and blue represents after intervention. TRF: time-restricted feeding; CD: control diet; (A) estimated glomerular filtration rate; (B) uric acid; (C) blood urea nitrogen; (D) cystatin-C; (E) weight; (F) body mass index; (G) total protein; (H) albumin; (I) tumor necrosis factor alpha; (J) interleukin 6; (K) serum phosphorus. Δ represents the difference, * represents p < 0.05.

