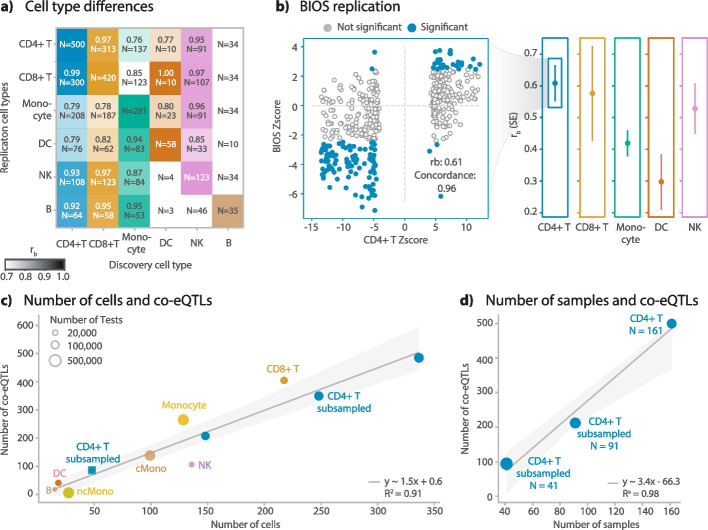
Fig. 4.
General characteristics of identified co-eQTLs. a Replication of discovered co-eQTLs across the major cell types. Correlation of the effect sizes in replications among different cell types, measured by rb value. Text inside each block indicates the rb value, and number of replicated co-eQTLs. Color intensity indicates rb value. For certain cell-type combinations, the number of co-eQTLs were too few to reliably estimate rb values. For those cell types, only the number of co-eQTLs is shown. b Replication in BIOS dataset for different cell types, indicated by the rb values. Scatter plot shows the detailed Z-score comparison between the co-eQTL meta-analysis and the Z-score from the BIOS replication for CD4 + T cells. c Number of significant co-eQTLs for varying cell numbers. Dot color indicates the cell type, as indicated in the text next to each dot. “cMono” means classical monocytes. “ncMono” means non-classical monocytes. “CD4 + T Subsampled cells” means that this analysis was done for CD4 + T cells, but for every individual we randomly downsampled cells to the desired cell number as indicated in the x-axis. d Number of significant co-eQTLs for varying sample numbers. “CD4 + T Subsampled Individuals” indicates that this analysis was done for CD4 + T cells, but we randomly subsampled for the individuals

