Fig. 5.
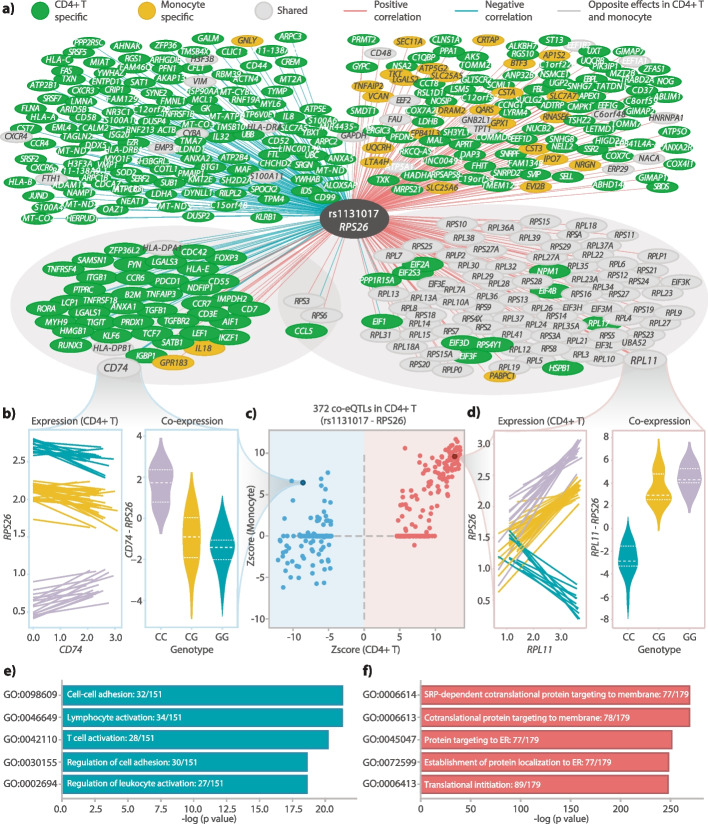
Annotation of co-eQTLs. a Union network constructed with co-eQTLs found in CD4 + T cells or monocytes that are associated with the SNP–eGene: rs1131017–RPS26. The two circled clusters contain co-eGenes that are in those corresponding GO terms. b Example of one co-eQTL: rs1131017–RPS26-CD74. Left plot indicates the co-expression patterns from all individuals in the Oelen v3 dataset. Each regression line was fitted using the normalized gene counts resulting from the “SCTransform” workflow [35], from one individual. Right plot indicates the co-expression values from the three genotype groups. c Comparison between Z-scores from monocytes and Z-scores from CD4 + T cells. Red dots indicate positive co-eQTLs from CD4 + T cells. Blue dots indicate negative co-eQTLs from CD4 + T cells. d Example of one co-eQTL: rs1131017–RPS26-RPL11 with the same layout as b. e GO term enrichment results for the co-eGenes in negative co-eQTLs from CD4 + T cells (top five GO terms for the Ontology Biological Process). f GO term enrichment results for the co-eGenes in positive co-eQTLs from CD4 + T cells (top five GO terms for the Ontology Biological Process)

