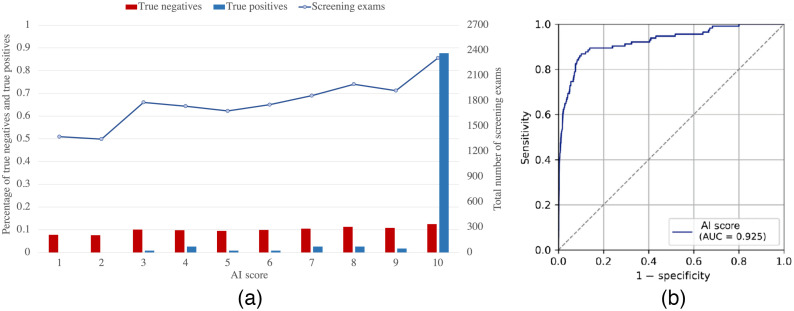
Fig. 2.
(a) Distribution of true negative, true positive, and total screen exams as a function of the AI system’s score (1 to 10). It is observed that normal tests are evenly distributed across all categories, with approximately 10% of all tests falling into each category, which is to be expected due to the calibration of the system. (b) ROC Curve and AUC value of the AI system evaluated over all exams.

