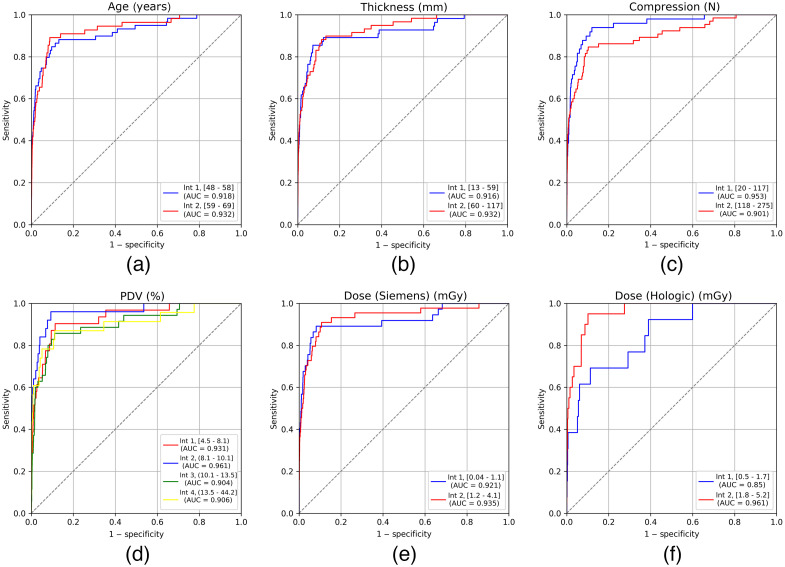
Fig. 6.
Comparison of the different ROC curves together with the corresponding AUC (legend) obtained for each of the intervals of each parameter, being (a) age of the woman, (b) thickness of the breast, (c) applied compression, (d) density in terms of PDV, (e) glandular dose from Vendor 1, and (f) glandular dose from Vendor 2.

