Figure 6.
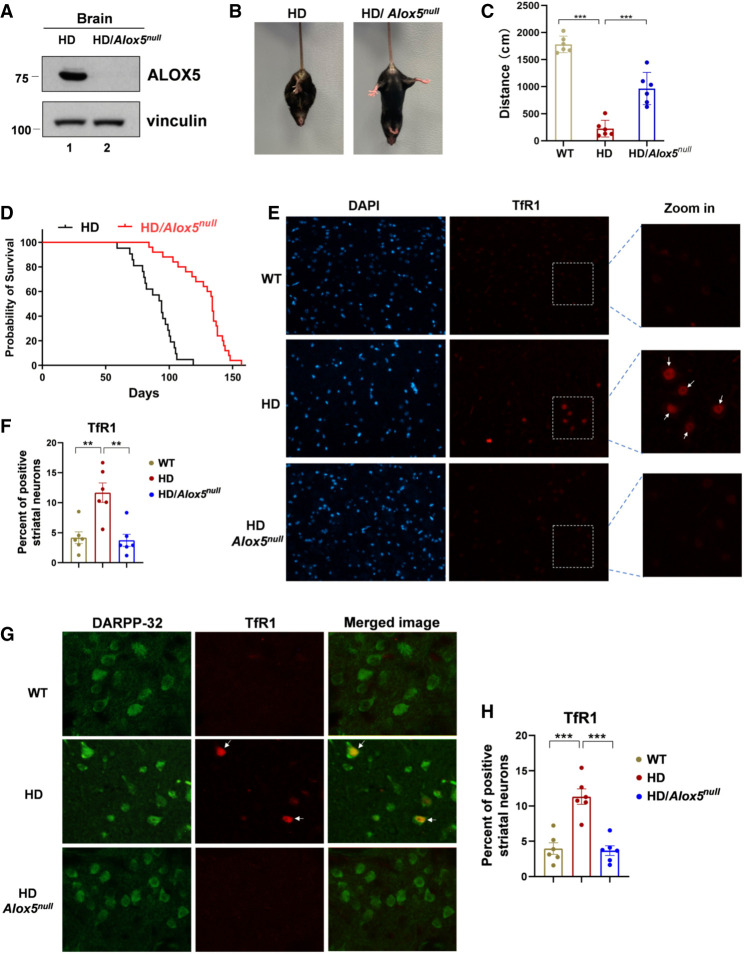
Loss of ALOX5 ameliorates the phenotypes and significantly extends the life spans of HD mice. (A) Western blot analysis for ALOX5 expression in HD and HD/Alox5-null mouse brains. (B) Representative images of limb clasping from the HD and HD/Alox5-null mice. (C) Open field test. Thirteen-week-old mice were subjected to open field test, and the distance moved was calculated. Six mice were used for each group (HD vs. HD/Alox5-null; P < 0.01). (D) Kaplan–Meier survival curves of HD (n = 21 independent mice) and HD/Alox5-null (n = 25 independent mice) mice. P-value was calculated using log-rank Mantel–Cox test (HD vs. HD/Alox5-null; P < 0.0001). (E,F) TfR1 staining on mouse brain slides. WT, HD-N171-82Q, and HD-N171-82Q/Alox5-null mouse brain paraffin slides were dewaxed, and antigens were retrieved by PH6.0 citric acid solution followed by incubation with TfR1 antibody. (E) Representative images of TfR1 staining (four mice for each group). Nuclei were stained with DAPI. (F) Quantification of TfR1-positive striatal neurons. Data are represented as mean ± SEM. (G) Representative images of TfR1 and DARPP-32 double staining on mouse brain paraffin slides. DARPP-32 was used as a marker for striatal medium spiny neurons (Naia and Rego 2018). (H) Quantification of TfR1-positive striatal neurons, related to G. Data shown in C, F, and H are the means ± SEM. n = 6. P-values were derived from two-tailed unpaired t-test. (***) P ≤ 0.001, (**) P ≤ 0.01.

