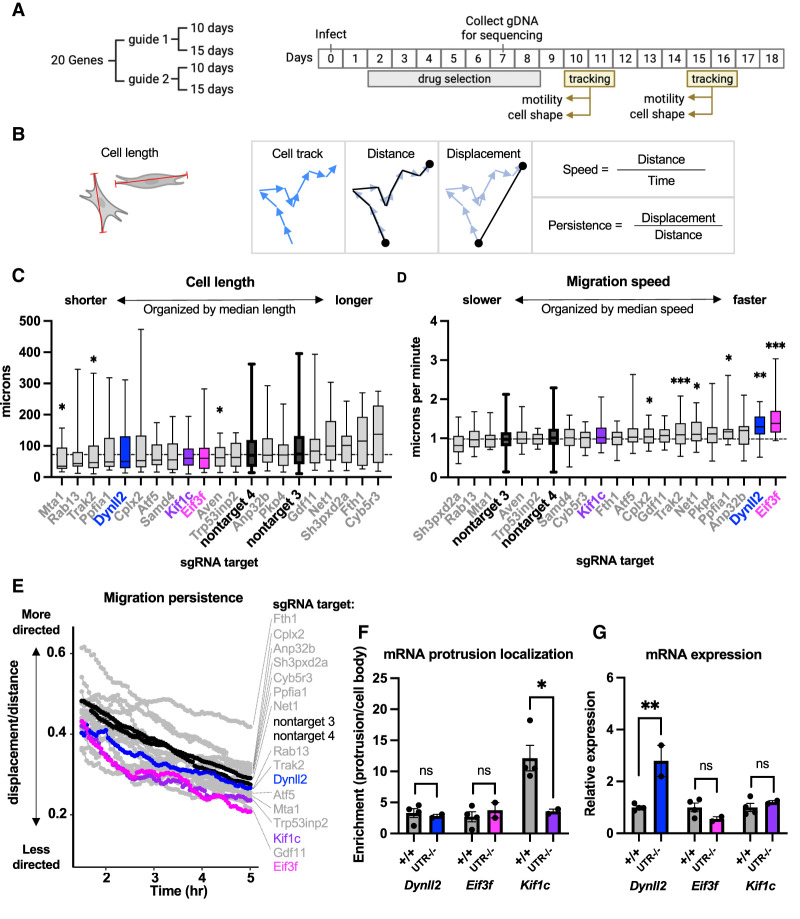
Figure 2.
Functional prioritization of localized mRNAs and identification of Kif1c as a model for further study. (A) Outline of phenotypic screen. Coding sequences of candidate genes were targeted individually with CRISPR/Cas9, selected with puromycin, and then analyzed for phenotypes at two different time points. (B) Schematic of phenotypic analyses. (Left) Cells were measured along their longest axis (red lines). (Right) Speed and persistence were measured from cell tracks (blue arrows) after calculating distance (total path length) and displacement (straight line between first and last time point). (C–E) Only the top treatment (guide and time point) is shown for each candidate gene. Genes are ordered based on their median measurement; horizontal dashed lines mark the median of nontarget control treatments. Nontarget guides, Dynll2, Eif3f, and Kif1c are denoted in black or color. All other candidates are in gray. Cells were tracked migrating on uncoated plastic dishes for 5 h. N = >15 cells per assay for candidate genes. N = >150 cells per assay for nontarget guides. (C) Box plots of cell length measured from still frames. (D) Box plots of migration speed measurements. In C and D, the box shows the 25th to 75th percentiles, and the line in the middle is the median. Whiskers are drawn down to the smallest value and up to the largest value. (E) Migratory persistence over time. (F,G) Mean and SEM from qRT-PCR on cells with endogenous 3′ UTR deletions. qRT-PCRs on fractionated cells were normalized to the diffuse mRNA Arpc3. qRT-PCR on bulk mRNA was normalized to Ywhaz. N = 2–4 biological replicates per condition. All statistical tests are unpaired t-test compared with +/+. (***) P < 0.001, (**) P < 0.01, (*) P < 0.05.

