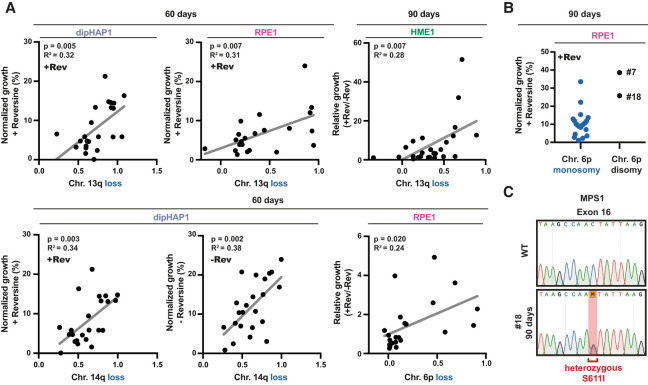
Figure 3.
Specific arm aneuploidies correlate with better growth in reversine. (A) Scatter plot of adapted populations from dipHAP1, RPE1, and HME1 cells harboring specific chromosome losses (0 indicates no loss, and 1 indicates chromosome loss; X-axis) versus their normalized (+Rev or −Rev) or relative (+Rev/−Rev) growth (Y-axis). Proliferation from colony formation assays was normalized to the untreated parental cell lines (WT). n = 2. Chromosome loss copy number data are from read frequencies using Illumina sequencing. P-values are from F-tests. (B) Normalized growth in reversine of the 90-d adapted RPE1 populations grouped by chromosome 6p copy number state. The two adapted RPE1 populations with 6p disomy are labeled with their cell line IDs (#7 and #18). (C) Sanger DNA sequencing chromatogram showing the presence of a heterozygous single-base-pair substitution in exon 16, leading to the MPS1S611I mutation in RPE1 population #18 at the 90-d time point.

