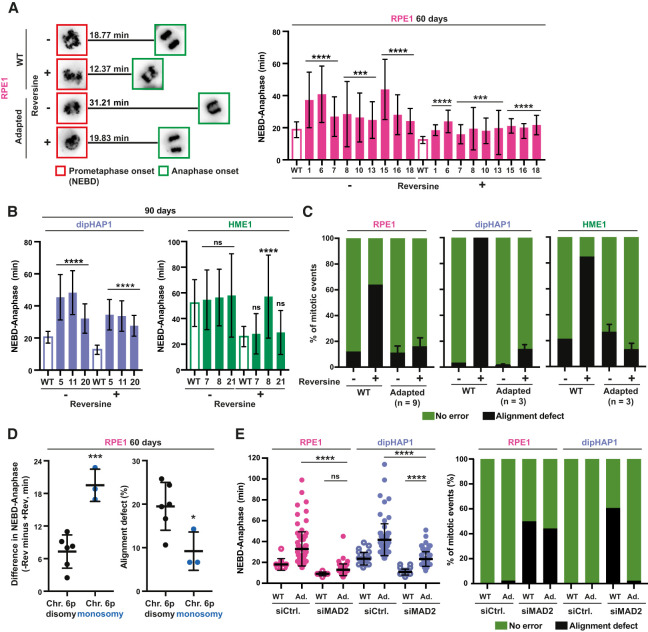
Figure 4.
Adapted cells with specific aneuploidies limit CIN by increasing mitotic duration. (A, left) Representative images from a time lapse of SiR-DNA-stained mitotic RPE1 cells at NEBD (red squares) and at anaphase onset (green squares) (full time-lapse is displayed in Supplemental Fig. S8B). The mean duration in minutes from NEBD to anaphase (n > 25 mitoses) is shown. (Right) Quantification of time from NEBD to anaphase (in minutes) with and without reversine for the unadapted parental RPE1 cell line (WT; empty bar) and nine adapted RPE1 cell lines (ID numbers; filled bars) at the 60-d time point. n = 3. (B) Quantification as in A, except for dipHAP1 and HME1. Unadapted parental cell lines (WT; empty bar) and three adapted populations (ID numbers; filled bars) each are depicted. n = 3. (C) Quantification of chromosome misalignment with and without reversine for the unadapted parental cell lines and the adapted cell populations from A and B. Alignment defects were measured as chromosomes that were not at the metaphase plate in the frame directly preceding anaphase. Error bars depict SD between the adapted populations (n depicted in the graph) of the respective cell line. (D, left) Difference in the NEBD-to-anaphase timing for 60-d adapted RPE1 populations with and without reversine. (Right) Percentage of mitoses with alignment defects with reversine in 60-d adapted RPE1 populations. Both are classified by the copy number state of chromosome arm 6p. The cell lines are the same as in A. (E, left) NEBD-to-anaphase duration for parental, 60-d adapted RPE1, and 90-d adapted dipHAP1 cell lines treated with either siRNAs for MAD2 or a scrambled control (siCtrl.). (Ad.) Adapted. Bars represent mean ± SD. P-values are from unpaired Student's t-tests. (*) P < 0.05, (***) P < 0.001, (****) P < 0.0001, (ns) not significant.

