Figure 2.
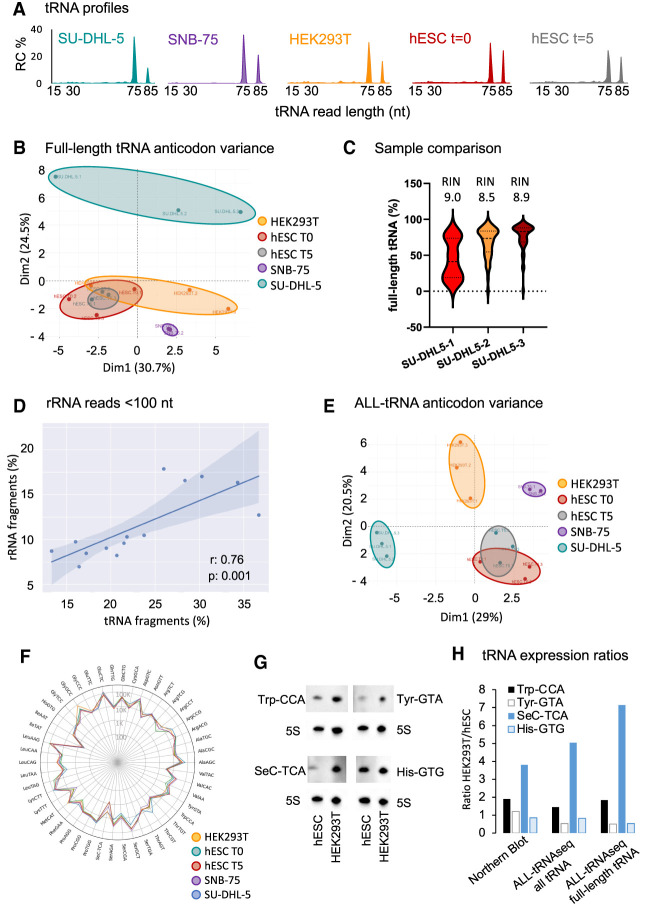
Inclusion of all tRNA reads detected by ALL-tRNAseq improves robustness of tRNA profiling. (A) tRNA read length distribution in percentage in cell lines SU-DHL-5, SNB-75, and HEK293T as well as proliferating and differentiated hESCs. (B) Principal component analysis (PCA) of full-length tRNA anticodon expression in HEK293T (n = 3), SNB-75 (n = 2), SU-DHL-5 (n = 3), hESC (n = 3), and differentiated hESCs (n = 3). (C) Violin plot of the full-length tRNA read fraction with the 3′-terminal CCA triplet in three replicates of the SU-DHL-5 cell line. (D) Pearson correlation of normalized tRNA fragments reads per million and normalized rRNA reads per million <100 nt. (E) PCA of tRNA anticodon expression including full-length and short tRNA-derived reads in HEK293T (n = 3), SNB-75 (n = 2), SU-DHL-5 (n = 3), proliferating hESCs (n = 3), and differentiated hESCs (n = 3). (F) Radar plot of all tRNA anticodon reads per million mapping to cytoplasmic tRNA, showing the distribution of reads per tRNA anticodon for SU-DHL-5 (blue line), HEK293T (orange line), proliferating hESCs (green line), differentiated hESCs (red line), and SNB-75 (purple line). Data are represented as log10 values on the radius. (G) Detection of tRNA-Trp-CCA, tRNA-Tyr-GTA, tRNA-His-GTG, and tRNA-SeC-TCA in 1 µg of total RNA isolated from proliferating hESCs (T = day 0) and HEK293T cell lines by Northern blot. 5S rRNA was used as a loading control. (H) Ratio in tRNA abundance between hESCs and HEK293T by quantification of Northern blot signal (left) compared with relative abundance detected by ALL-tRNAseq including all tRNA reads (middle) and full-length tRNA reads only (right). Band intensities were quantified by ImageJ, background-subtracted, and normalized to 5S rRNA signal.

