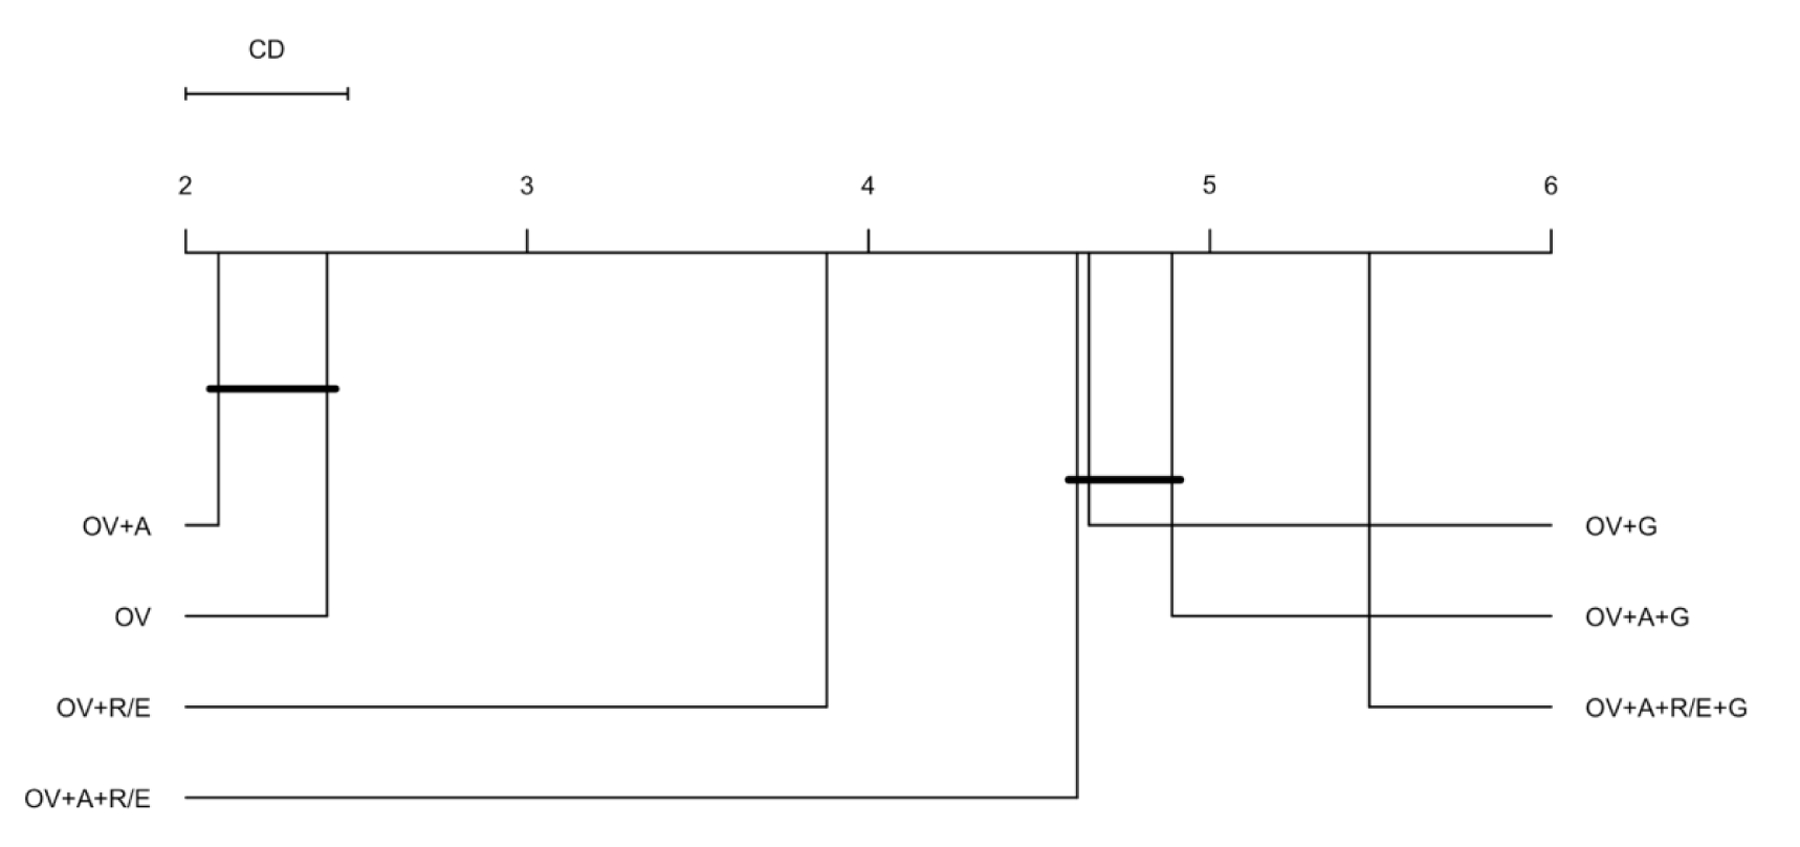
Figure 3.
CD diagram of the average encoder performance rankings by features.

* OV: observation value, A: age at observation, G: gender (male/female), and R/E: Race/Ethnicity (American Indian or Alaska Native, Asian, Black or African American, Native Hawaiian or other Pacific Islander, White Only, Multiple Race/Ethnicity, Hispanic, and unknown).
