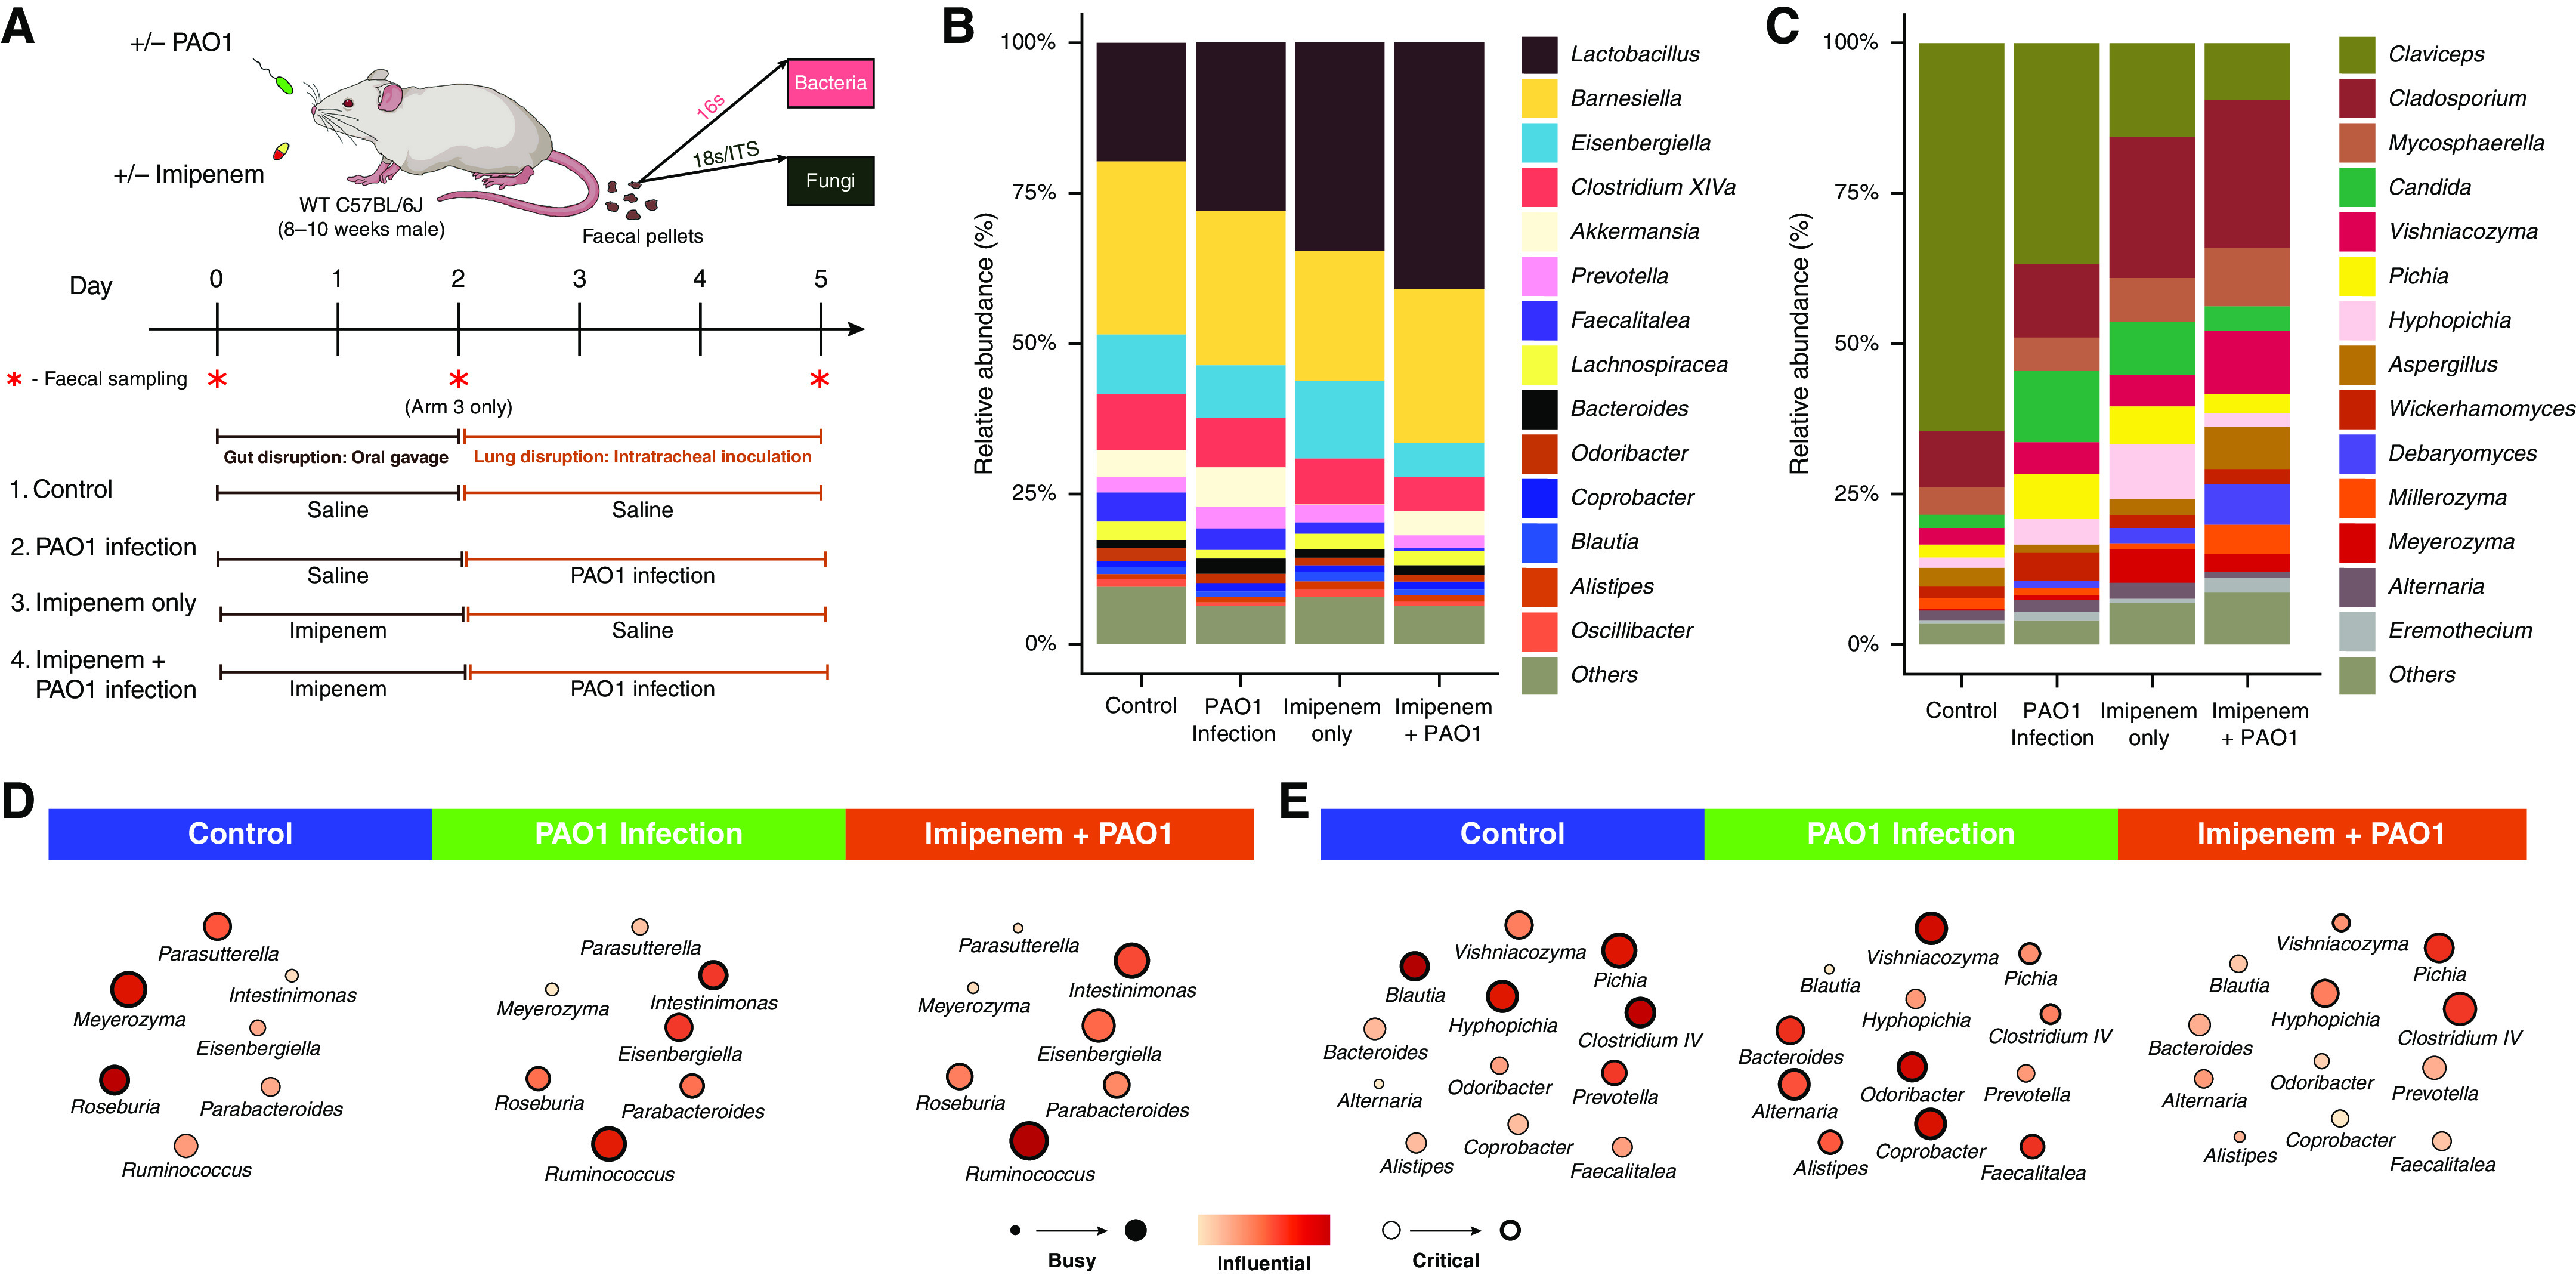
Figure 4.

Assessment of gut microbiome dynamics in a murine model of lung Pseudomonas aeruginosa (PAO1) infection. (A) Schematic illustration of the overall experimental design. Twenty-four mice were subjected to four experimental treatment arms (n = 6 per arm). Mice received either a saline control (1 + 2) or antibiotic treatment (imipenem) (3 + 4) by oral gavage for 2 days before either intratracheal delivery of normal saline (1 + 3) or PAO1 inoculation (2 + 4). Bacteriome and mycobiome profiles were characterized by 16S and ITS sequencing approaches derived from fecal pellets obtained at the experimental endpoint (day 5). In addition, assessment of bacteriome and mycobiome profiles pre- and postantibiotic treatment on day 0 and day 2 in treatment arm 3 (indicated by red asterisk) was performed. (B and C) Stacked bar plots illustrate the (B) gut bacteriome and (C) gut mycobiome composition in all four experimental arms (day 5). (D and E) Network plots illustrating key taxa from the mouse gut interactome splitting organisms (D) affected by PAO1 infection independent of antibiotic (imipenem) pretreatment to those (E) affected by PAO1 infection and abrogated by antibiotic (imipenem) pretreatment (see also Figure E7). Microbial genera are represented as nodes indicated as busy (i.e., node degree: microbes with a higher number of direct interactions with other microbes), critical (i.e., stress centrality: microbes key to maintaining the network’s integrity), and/or influential (i.e., betweenness centrality: microbes that influence other microbes within the network, including indirectly), and these network metrics are highlighted by size, width, and node coloration, respectively, in the presented network plots (7). WT = wild-type.
