Figure 5.


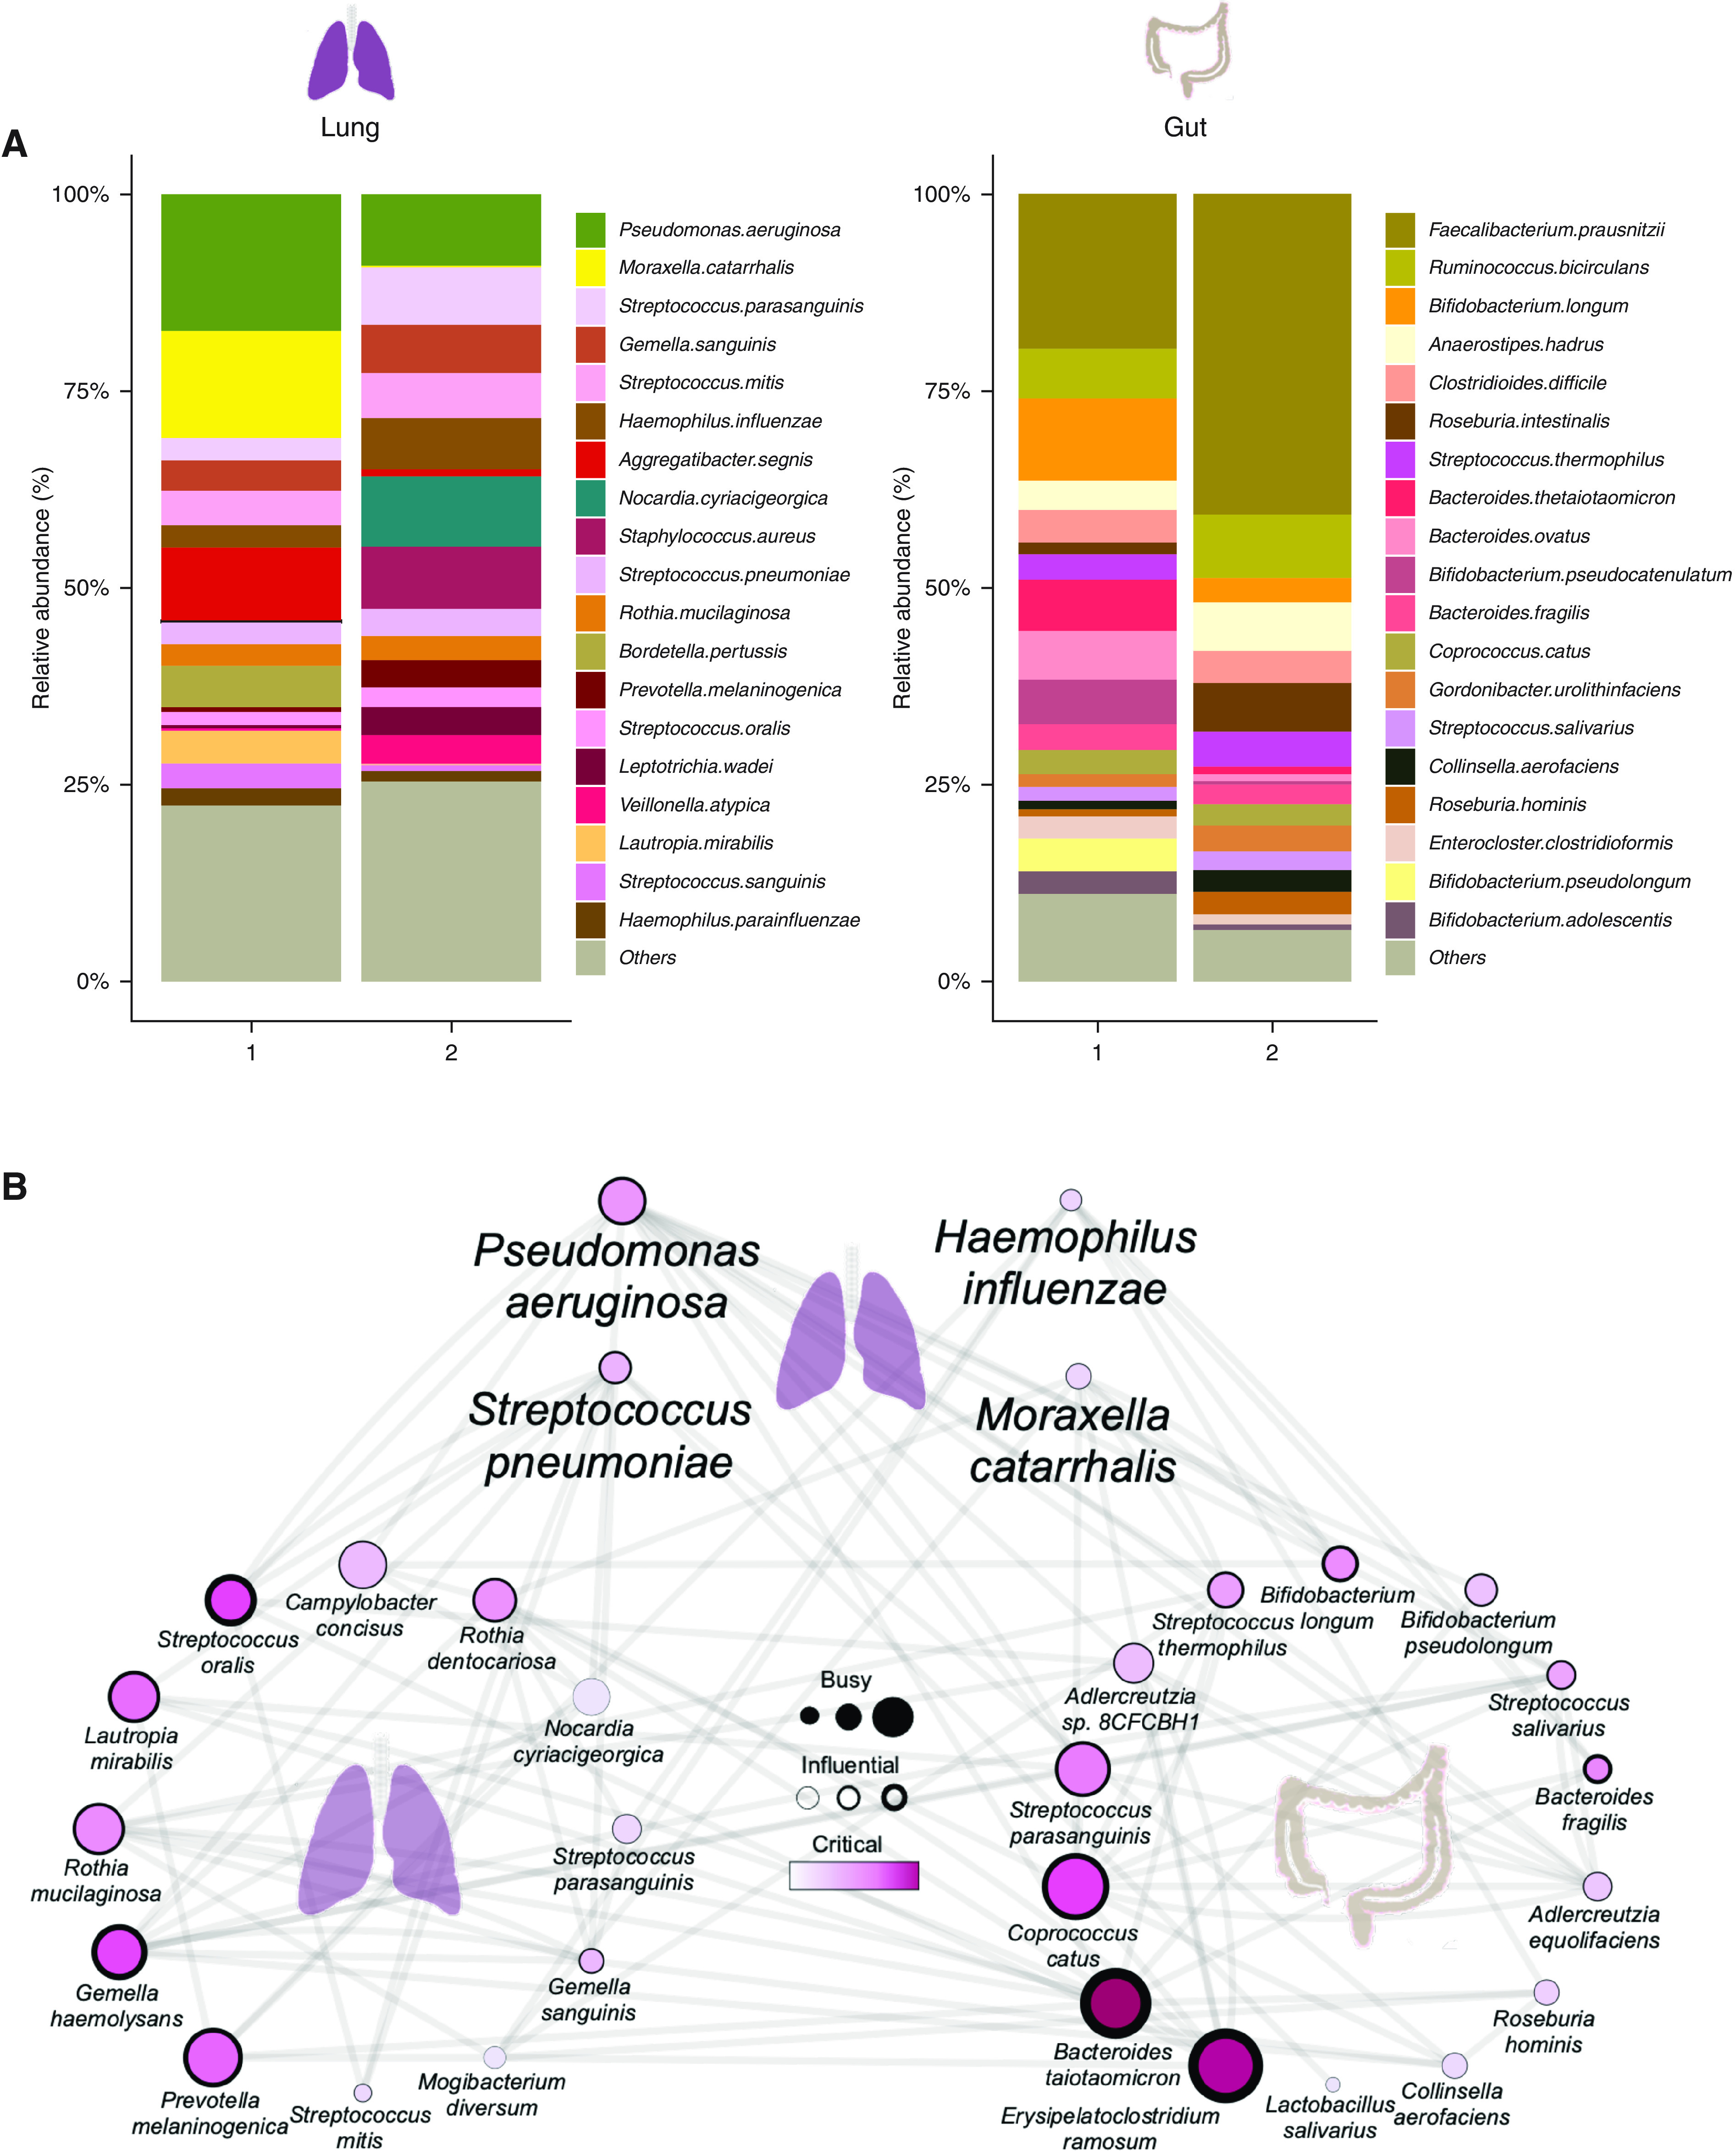
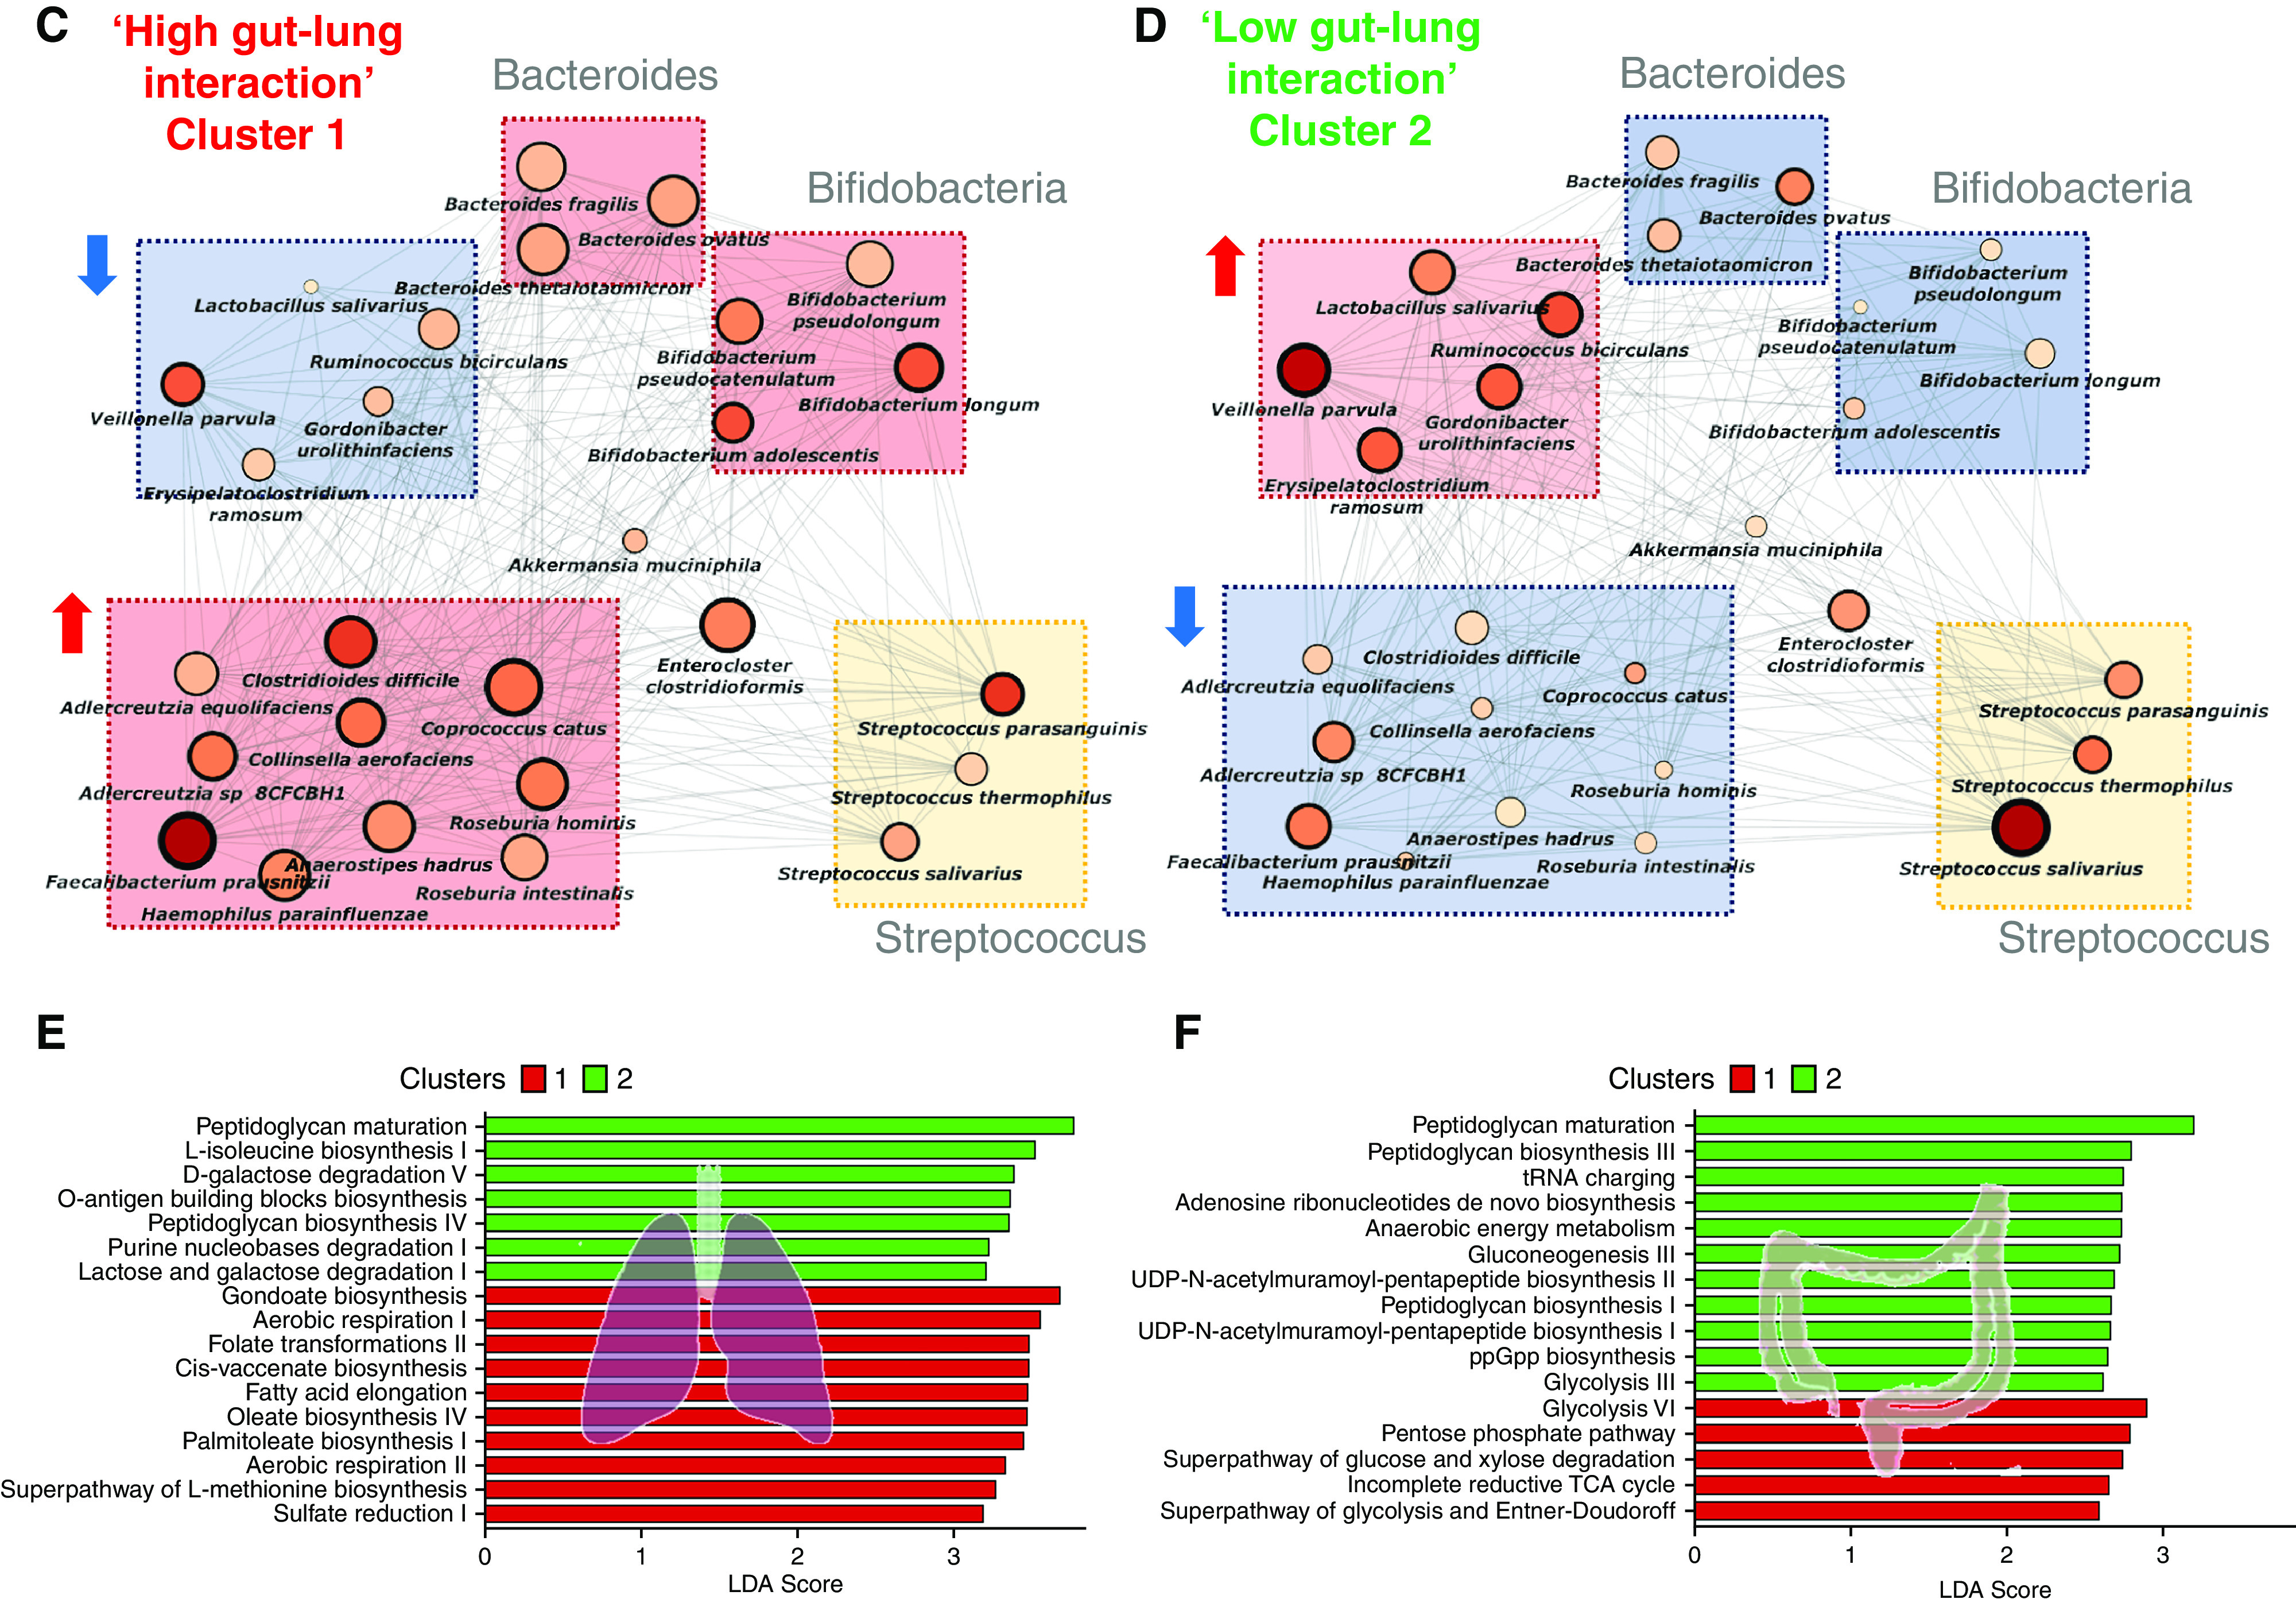
Metagenomic analysis of the gut-lung axis in bronchiectasis. (A) Stacked bar plots illustrating species-level classification of lung (left) and gut (right) microbiome relative-abundance profiles derived by metagenomic sequencing in high (cluster 1, n = 7) and low (cluster 2, n = 8) gut-lung interaction groups. (B) GBLM-derived networks illustrating four key bronchiectasis (bacterial) pathogens and their interactions with other microbes within the bronchiectasis gut-lung interactome. Microbial interactions (edges) are represented as lines (gray), and species as nodes are indicated as busy (i.e., node degree: microbes with a higher number of direct interactions with other microbes), critical (i.e., stress centrality: microbes key to maintaining the network’s integrity), and/or influential (i.e., betweenness centrality: microbes that influence other microbes within the network, including indirectly), and network metrics are highlighted by size, width, and node coloration, respectively, in the presented network plots (7). (C and D) Correlation-based co-occurrence analysis illustrating cluster-based gut microbiome network conformation of the (C) high gut-lung interaction (cluster 1) and (D) low gut-lung interaction (cluster 2), respectively. Species are grouped according to their observed genus-level differential network connectivity within clusters. Genera with three or more representative species-level members (i.e., Bacteroides, Bifidobacteria, and Streptococcus) are highlighted by colored rectangles indicating their respective increased (red), decreased (blue), or neutral (yellow) genus-level network connectivity between clusters. (E and F) Horizontal bar plots illustrating differentially abundant microbial pathways (linear discriminant analysis [LDA] score >2.5) between the high (cluster 1) and low (cluster 2) gut-lung interaction groups in the (E) lung and (F) gut, respectively. The x-axis represents the discriminative score (LDA score), and the y-axis represents specific microbial pathways.
