Figure 1.
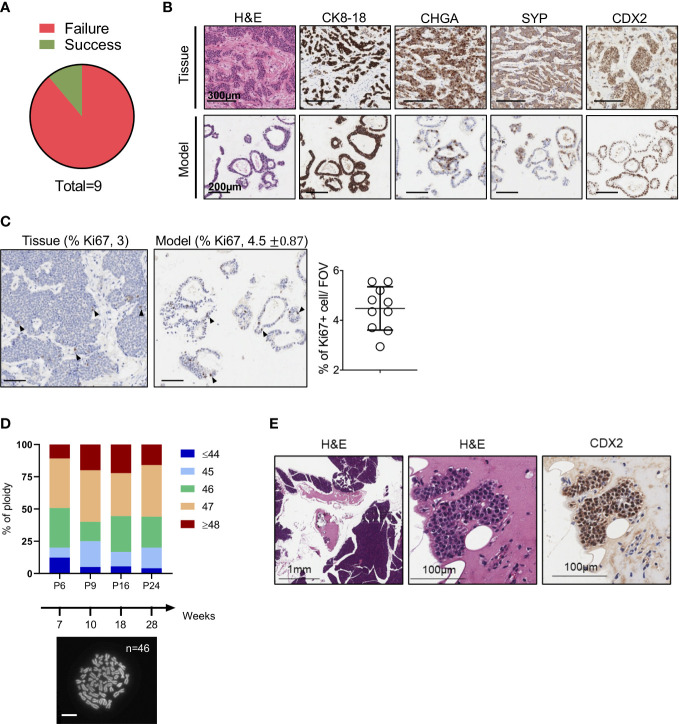
Establishment of NET Organoids. (A) Pie chart showing successful rate of organoids establishment from neuroendocrine tumor specimens. (B) Representative hematoxylin and eosin (H&E) staining and immunohistochemistry for cytokeratin 8-18 (CK8-18), chromogranin A (CHGA), synaptophysin (SYP), and caudal type homeobox 2 (CDX2) of the organoid culture and patient’s tissue (case HCM-CSHL-0608-17). Scale bars as indicated. (C) Representative immunohistochemistry for Ki67 of the organoid culture and the patient’s tissue. Scale bars, 200 µm. Quantification is provided at the top of the figure as percentage of Ki67 positive nuclei for both the tissue and the organoid culture. Standard Deviation is only shown for the organoid culture (see Methods). The scatter dot plot on the right displays the % of positive Ki67 nuclei in 10 fields of investigation (FOV, 20x magnification) for the organoid culture. (D) Ploidy analysis of the model at passage 6, 9, 16, and 24 over 28 weeks of continuous propagation. The proportion of metaphases with different number of chromosomes are represented by different colors as indicated in the legend. At the bottom, representative image of organoid metaphases used for the ploidy analysis. Scale bar, 10 μm. (E) Representative H&E staining and immunohistochemistry for CDX2 of the mouse pancreatic tissues collected 3 months after the injection of the organoid culture into the pancreas of immunocompromised mice. Scale bars as indicated.

