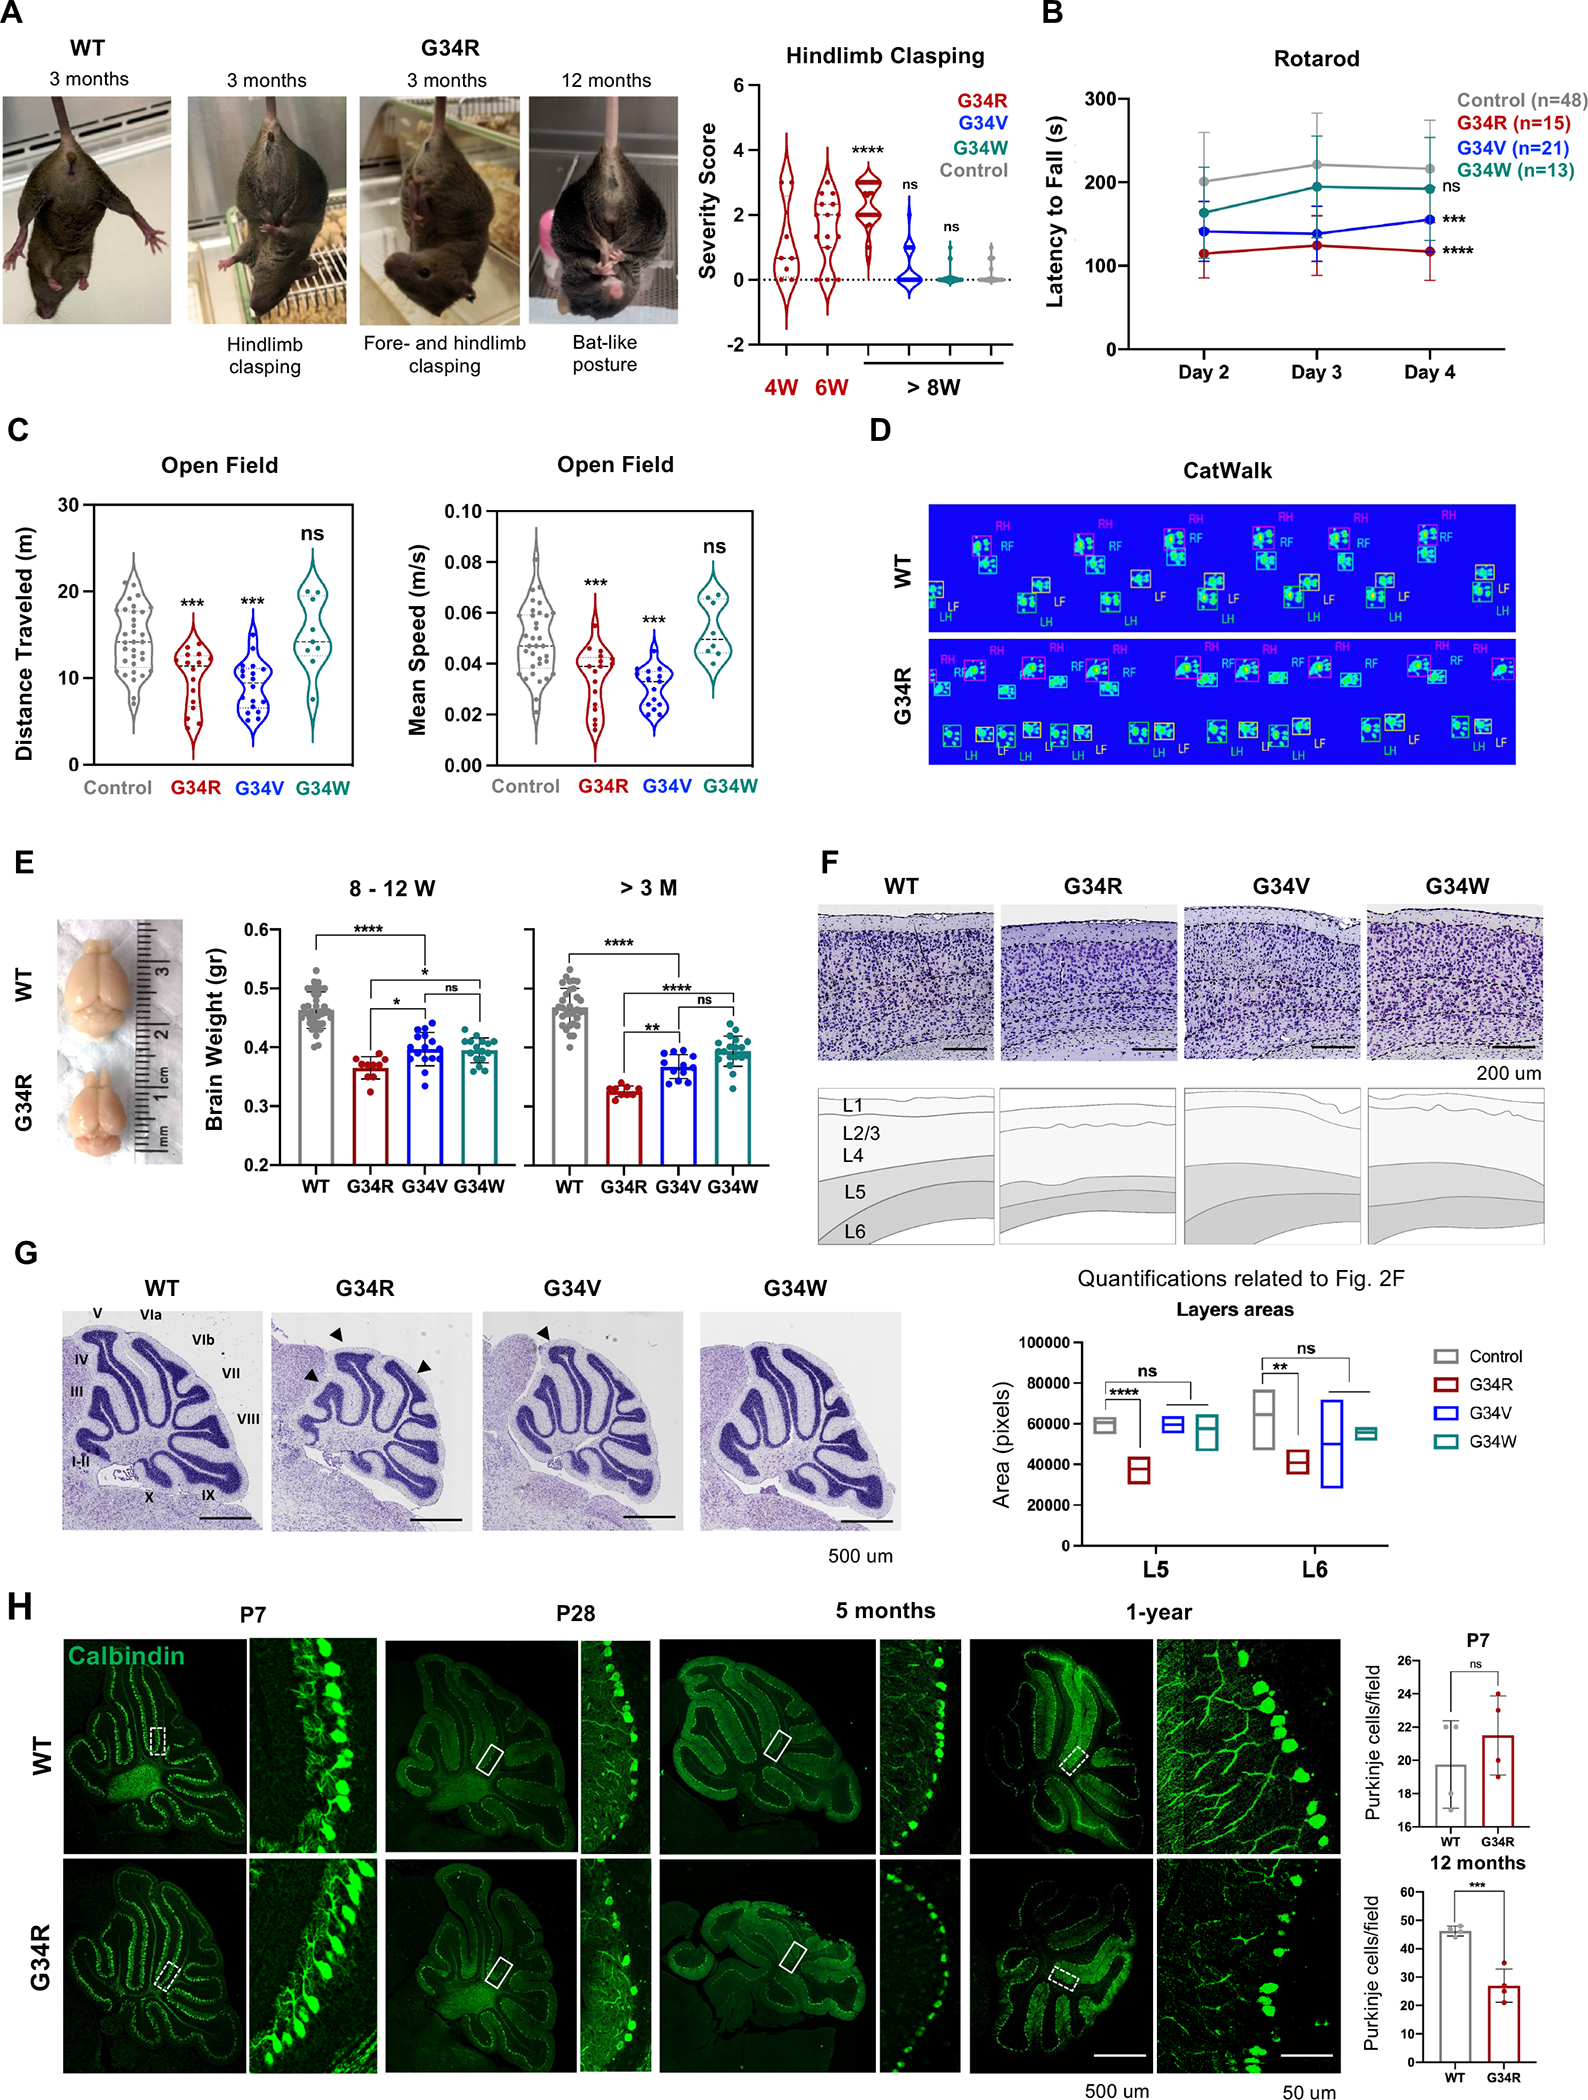
Figure 2. G34R/V mice show abnormal motor functions and progressive microcephaly.

A. Adult WT and G34R mice exhibiting hind- and fore-limb clasping. Right: quantitative measure of hindlimb clasping score for G34R mice at adolescence (< 8 weeks) and adult (> 8 weeks), compared to G34V/W and controls (n > 10). Each mouse is plotted individually. Dashed lines: median. Dotted lines: quartiles. Student’s t-test. **** P < 0.0001 and n.s.: non-significant. B. Adult G34R/V show impaired motor coordination and balance compared to G34W and control mice (n > 10). The data is presented as means ± SD. Two-way ANOVA. ***P < 0.001, **** P < 0.0001 and n.s.: non-significant. C. Adult G34R and G34V mutants show hypoactivity in open field test compared to G34W and control animals (n > 6). Each mouse is plotted individually. Dashed and dotted horizontal lines indicate the median and quartiles, respectively. Student’s t-test. ***P < 0.001 and n.s.: non-significant. D. G34R animals show abnormal gait shown by representative digitized mice footprints, as recorded during the CatWalk test of WT (upper) and G34R (lower) littermates. RF, right front; RH, right hind; LF, left front; LH, left hind. E. Image and brain weight of adult G34 mutant mice showing progressive microcephaly in G34R animals (n > 10). Each mouse is plotted individually and as means ± SD. Student’s t-test. *P < 0.05, **P < 0.01, **** P < 0.0001 and n.s.: non-significant.F. Nissl staining of midsagittal cerebral cortex of control and G34 mutant mice showing thinning of L5/6 in G34R animals. Top panel: Cresyl Violet, bottom panel: scored cortical cell layers. Below, quantification of cerebral cortex layers (L5, layer 5; L6, layer 6) areas of control (n=4) and G34 mutant mice (G34R n=3, G34V n=2, G34W n=3) using the Cresyl Violet (Nissl staining). Line: mean. Student’s t-test. **P < 0.01, **** P < 0.0001 and n.s.: non-significant. G. Representative Nissl staining of midsagittal brain slices of control and G34 mutant cerebellum. Note the simplified cerebellum foliation in G34R brain (black arrowheads). H. Representative confocal images of cerebellar para-sagittal sections from control and G34R mice stained for Calbindin (green), a marker of Purkinje neurons. Left: 10X. Right: 20X. The white hatched areas (inset) of P7 and 12-month cerebellar images were used for quantification (n=4) (upper panel). The result of each mouse is plotted individually and as means ± SD. Student’s t-test. ***P < 0.001 and n.s.: non- significant.
