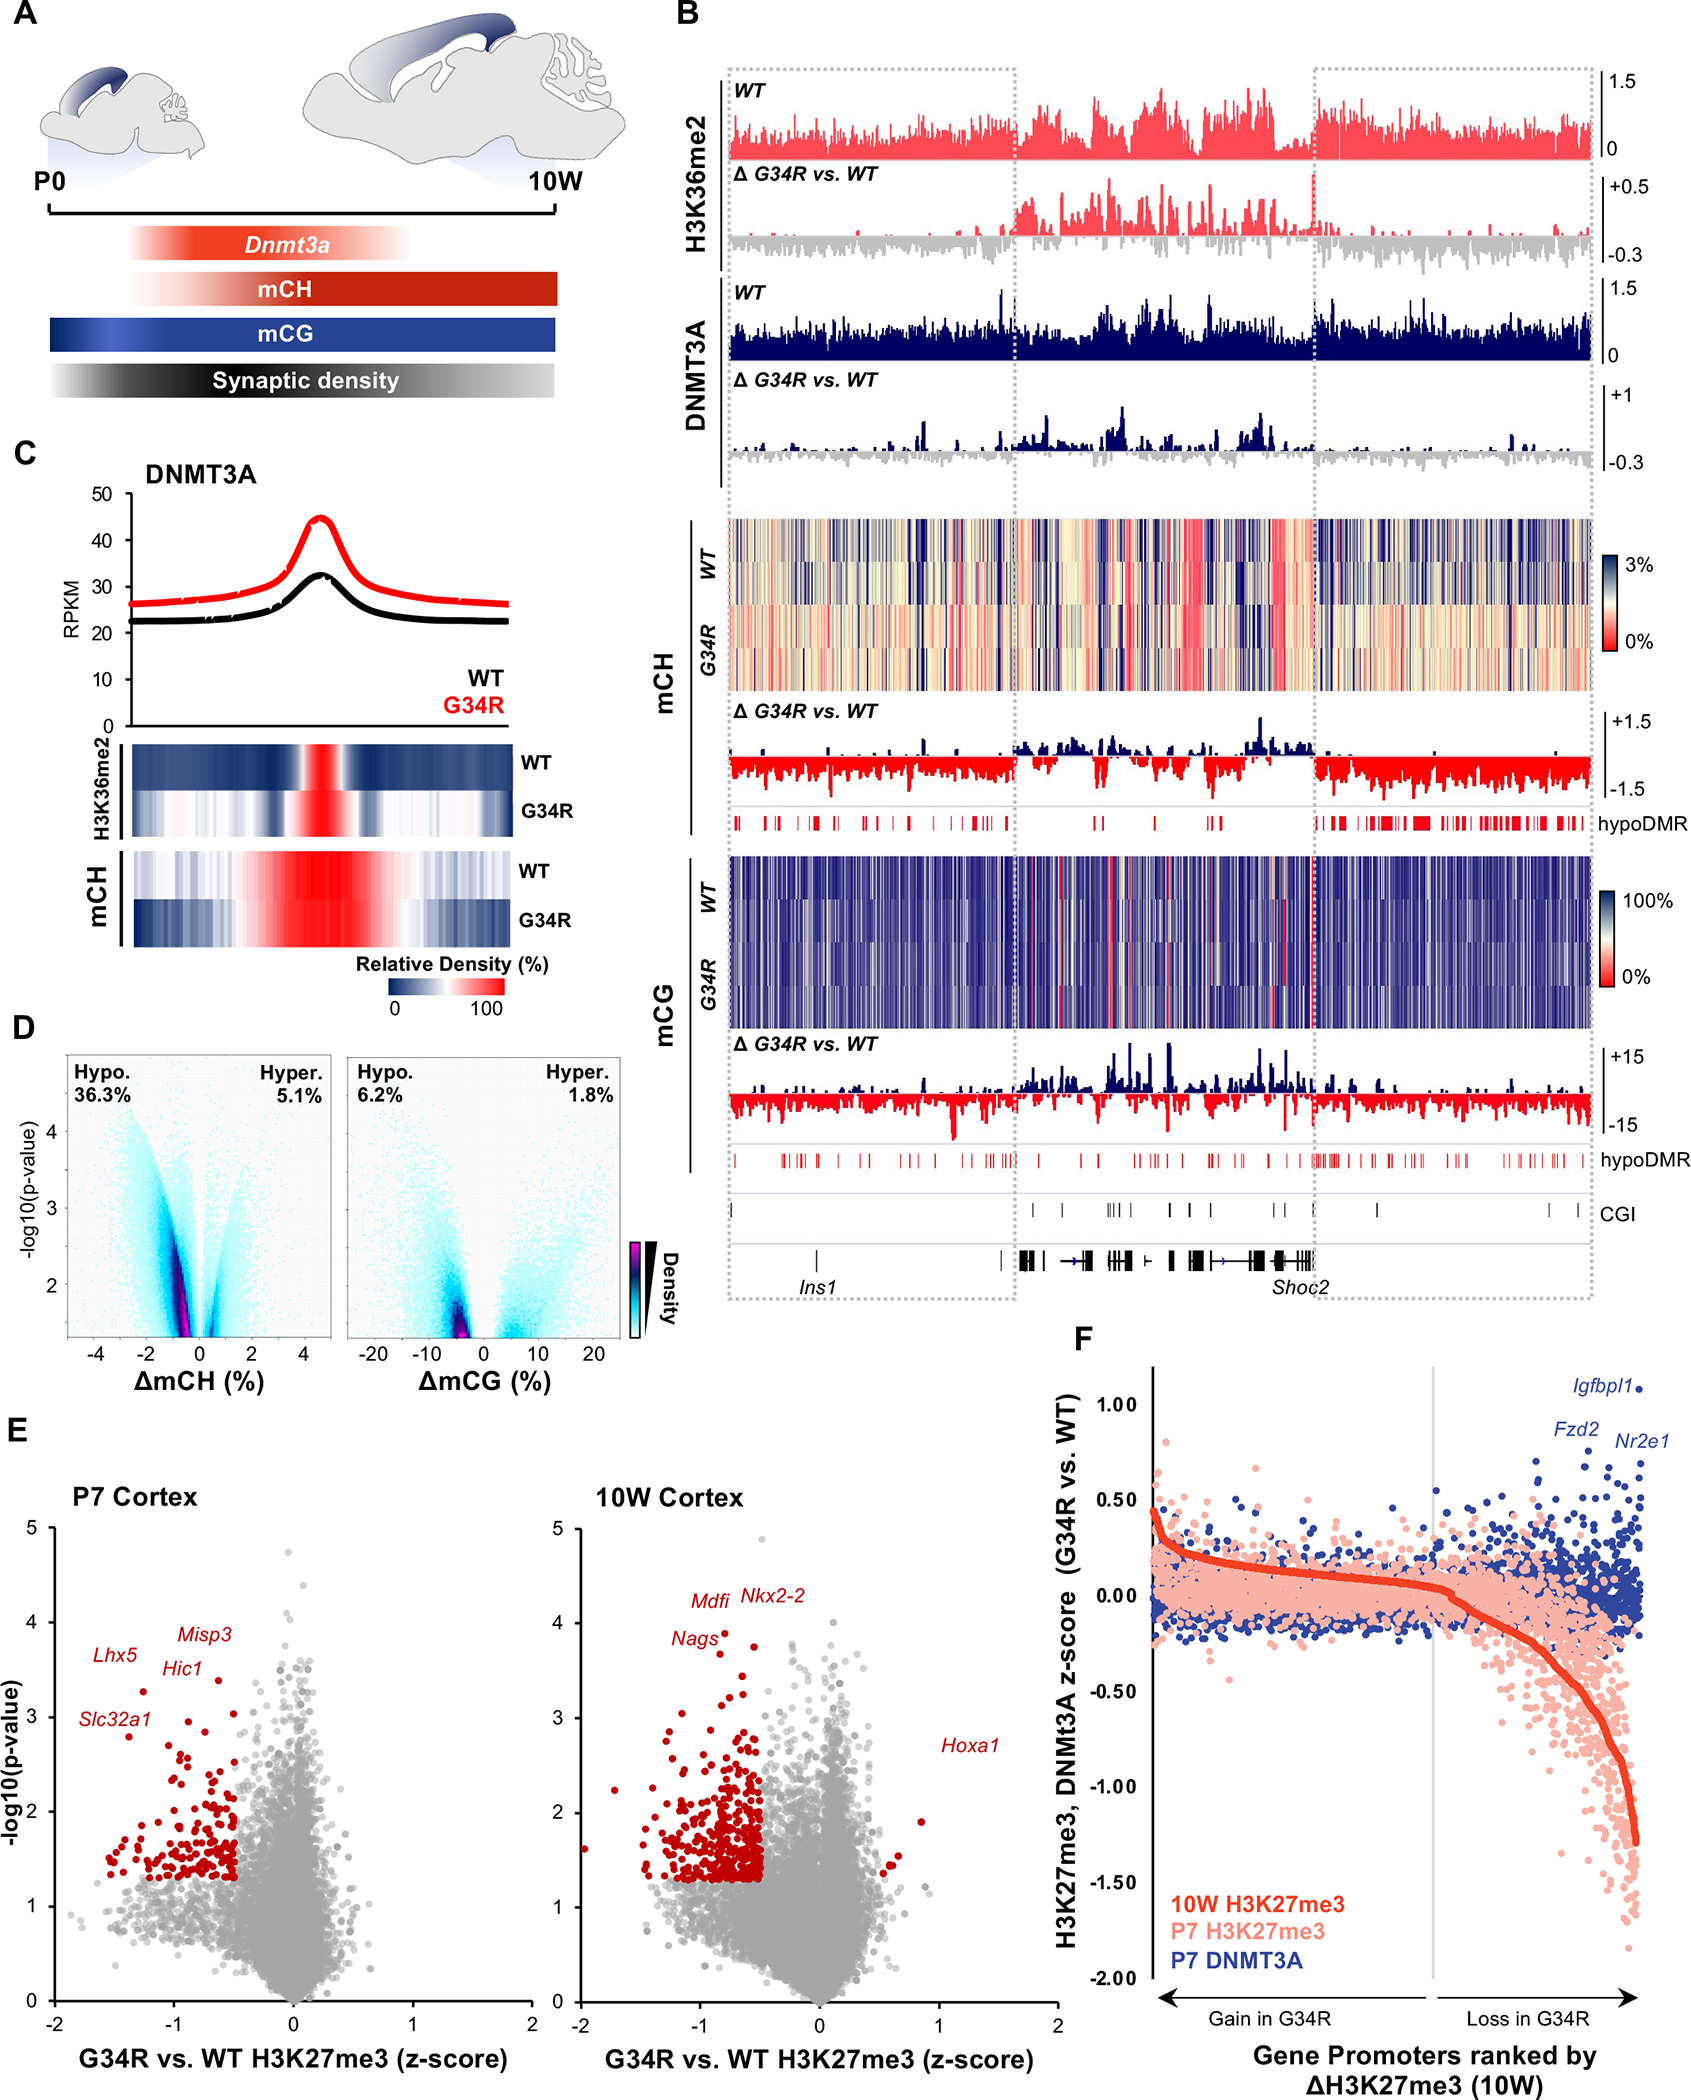
Figure 5. G34R re-distribute DNMT3A localization, causing loss of CH methylation at intergenic regions.

A. Schema depicting post-natal expression pattern of Dnmt3a and accumulation of mCH/mCG levels in the developing murine cortex. B. Genome browser snapshot depicting G34R-mediated epigenomic change in P7 (H3K36me2, DNMT3A) and 10W adult cortex (mCH, mCG). Upper tracks depict the epigenomic feature in WT cortex and change in G34R is depicted below (loss: grey). C. Metaplot of DNMT3A at called peaks in G34R and WT cortex (n=2). Under, heatmap depicting relative enrichment of H3K36me2 and mCH at DNMT3A peaks. D. Volcano plot depicting CH (left) and CG (right) methylation changes from G34R vs. WT (n = 2) in genome-wide 5kb bins. Hypo- and hyper-methylated bins are scored as p < 0.05 using LIMMA. E. Volcano plot depicting loss of H3K27me3 at gene promoters in P7 and 10W cortex of G34R mice (n = 2). F. Gain of DNMT3A occupancy (blue dots) at gene promoters losing the most H3K27me3 (right side of graph) in G34R cortex. Promoters were ranked by descending Z-score for H3K27me3 (10W G34R vs. WT, red), color dots represent corresponding change in H3K27me3 (pink) and DNMT3A (blue) at P7.
