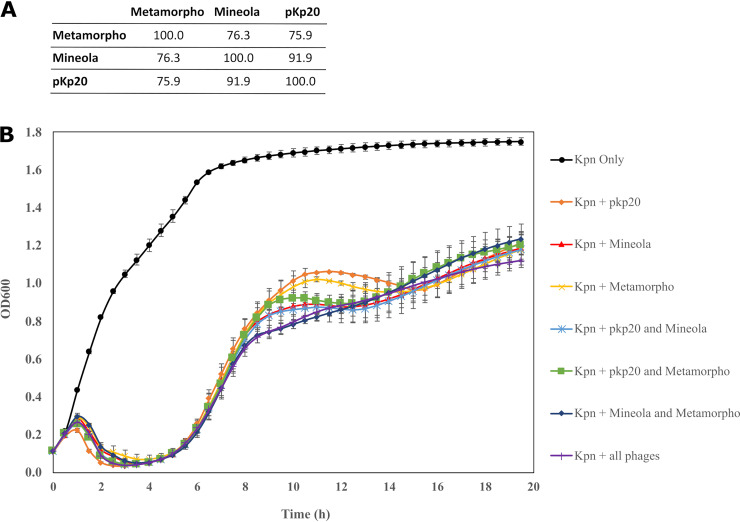
FIG 2.
Characterization of individual phages and phage cocktails. (A) DNA sequence relatedness of the three phages, showing the pairwise percent DNA sequence identities, as determined by ProgressiveMauve. (B) Inhibition activity of individual and phage cocktails (of two phages and of three phages) against the patient isolate (from April of 2021) at a multiplicity of inhibition of 0.01 over a 20 h period. The error bars represent the standard deviation (SD) from two independently repeated experiments.

