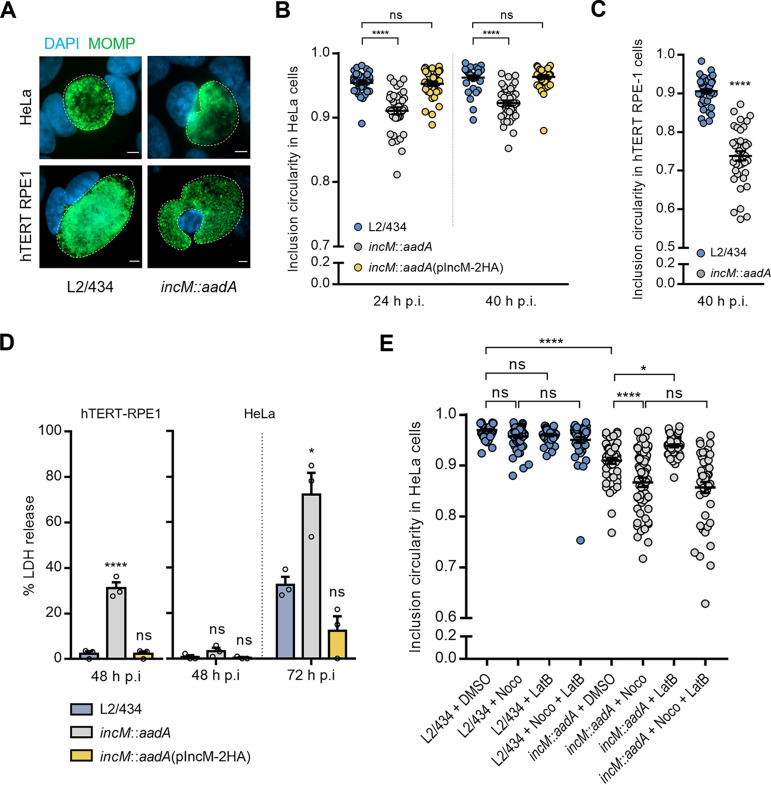
FIG 5.
IncM modulates inclusion morphology and integrity. HeLa (A, B, D, and E) or hTERT-RPE1 (C) cells were infected at a MOI of 0.1 (A, B, and E) or 0.5 (D) with C. trachomatis strain L2/434, incM::aadA, or incM::aadA harboring a plasmid encoding IncM with a C-terminal 2HA epitope tag (pIncM-2HA). Cells were fixed with methanol, immunolabeled with anti-C. trachomatis MOMP (green) antibodies, stained for the nuclei with DAPI (blue), and analyzed by fluorescence microscopy. (A) Representative images of the inclusion morphology in HeLa and hTERT-RPE1 cells infected by the indicated strains for 40 h. Scale bars, 5 μm. (B and C) Cells were fixed at 24 and 40 h p.i. (B) or only at 40 h p.i. (C), and the circularity of each inclusion was assessed using Fiji (75). (D) HeLa and hTERT-RPE1 cells were infected at an MOI of 0.5. At the indicated times p.i., the release of host LDH into the supernatant of infected HeLa cells was measured using a CytoScan LDH cytotoxicity assay kit (G-Biosciences). As described in Materials and Methods, the values (percentages) of LDH released were related to the amount of LDH activity in uninfected cells after their lysis with Triton X-100. (E) Cells were fixed at 30 h p.i. after being treated with nocodazole (Noco) and/or latrunculin B (LatB), as described in Materials and Methods, or with the solvent DMSO as control, and the circularity of each inclusion was assessed using Fiji (75). Values represent means ± standard errors of the means, n = 3, ≥30 inclusions per experiment (B, C, and E). P values were obtained using one-way ANOVA and Dunnett’s (B, C, and D) or Tukey’s (E) post hoc test analyses; statistical comparisons are only shown for cases mentioned in the main text. ns, not significant; *, P < 0.05; ***, P < 0.001; ****, P < 0.0001.

