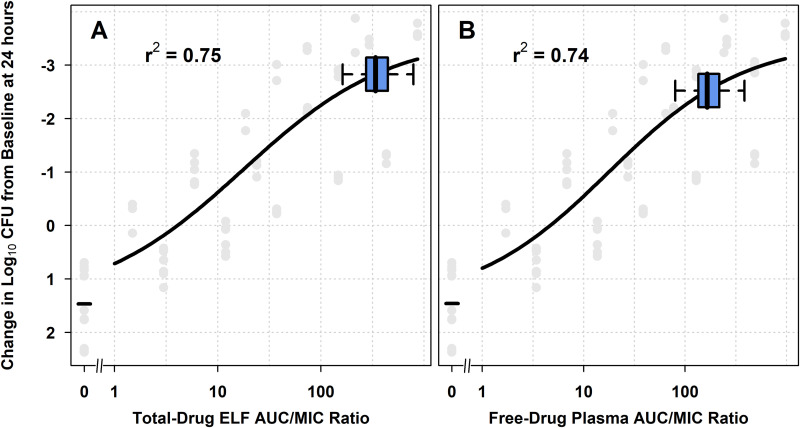
FIG 2.
Nonclinical PK-PD relationships for efficacy for S. pneumoniae, overlaid with box-and-whisker plots of total-drug ELF and free-drug plasma AUC/MIC ratios on days 1 and 2 (A and B, respectively) for simulated patients after the administration of omadacycline 100 mg i.v. q12h on day 1 followed by 100 mg i.v. q24h on day 2 and 300 mg p.o. q24h on days 3 to 5. Horizontal box-and-whisker plots of total-drug ELF and free-drug plasma AUC/MIC ratios on days 1 and 2 for simulated patients after administration of omadacycline 100 mg i.v. q12h on day 1 followed by 100 mg i.v. q24h on day 2 and 300 mg p.o. q24h on days 3 to 5 are shown overlaid on the PK-PD relationship based on data from a neutropenic murine-lung infection model for S. pneumoniae. For each boxplot, the edge of the box represents the 25th to the 75th percentiles of the distribution for total-drug ELF or free-drug plasma AUC/MIC ratio. The line within the box represents the median total-drug ELF or free-drug plasma AUC/MIC ratio. The whiskers extend to the nearest value among those represented by 1.5× IQR of the box edges, where IQR is interquartile range as defined by the distribution of total-drug ELF or free-drug plasma AUC/MIC ratio from the 25th to the 75th percentiles.

