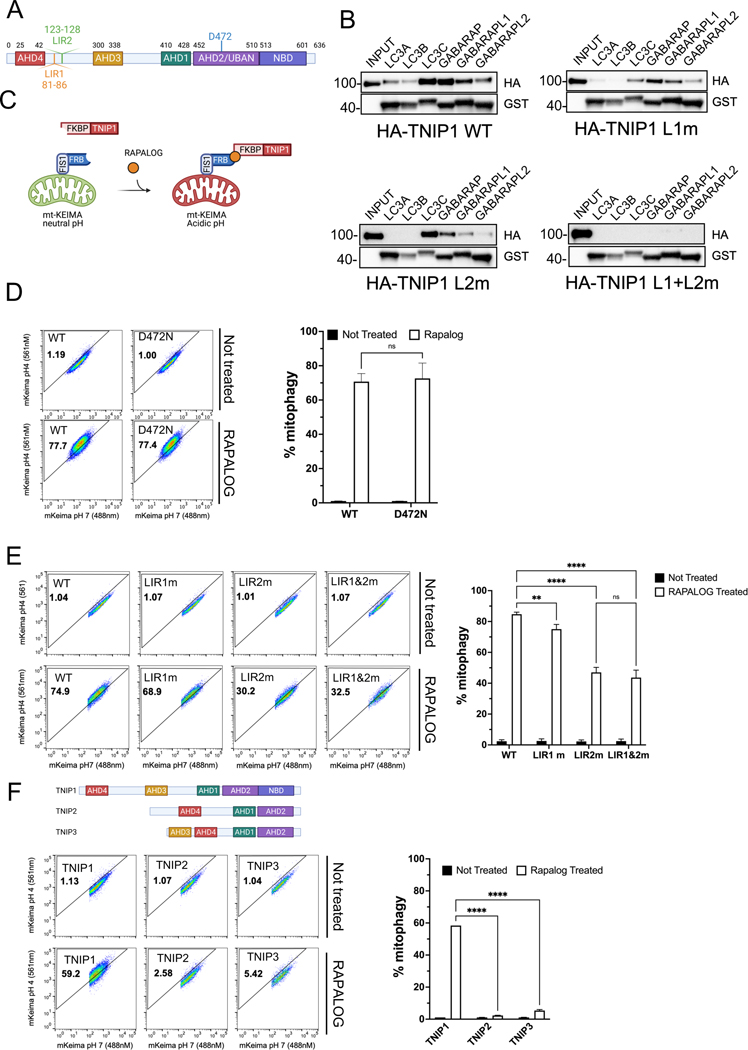
Fig. 1. Ectopic localization of TNIP1 to the mitochondria induces mitophagy.
(A) Schematic representation of TNIP1 and its 2 identified putative LIR motifs.
(B) HeLa cells stably expressing HA-TNIP1 wild type, LIR1 mutant, LIR2 mutant or LIR1+LIR2 double mutant co-immunoprecipitated (co-IP) with purified recombinant GST tagged mATG8 proteins and subjected to immunoblot analysis (IB).
(C) Schematization of CID experiment.
(D) HeLa cells stably expressing mito-mKeima, FRB-FIS1 and FKBP-GFP-TNIP1 WT or UBAN mutant (D472N) were treated with Rapalog for 24 h and subjected to FACS analysis. Left, representative FACS plot. Right, bar graph representing data as mean ± SEM obtained from 3 independent replicates.
(E) HeLa cells stably expressing mito-mKeima, FRB-FIS1 and FKBP-GFP-TNIP1 WT, LIR1 mutant, LIR2 mutant or LIR1&LIR2 double mutant were treated with Rapalog for 24 h and subjected to FACS acquisition. Left, representative FACS plot. Right, bar graph representing data as mean ± SEM obtained from 3 independent replicates.
(F) Top, schematic representation of the TNIP family TNIP1, TNIP2 and TNIP3. Bottom, HeLa cells stably expressing mito-Keima, FRB-FIS1 and FKBP-GFP-TNIP1, FKBP-GFP-TNIP2 or FKBP-GFP-TNIP3 were treated with Rapalog for 24 h and subjected to FACS acquisition. Left, representative FACS plot. Right, bar graph representing data as mean ± SEM obtained from 3 independent replicates.

