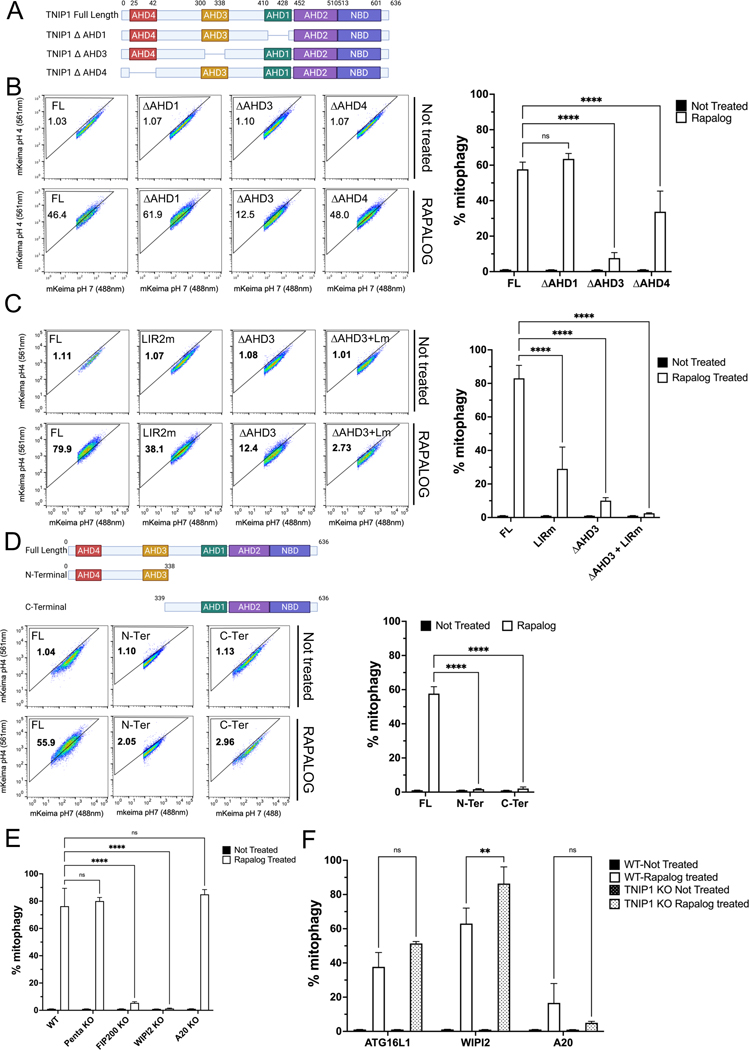
Fig. 2. IR2 and AHD3 domain of TNIP1 are essential for its role in mitophagy.
(A) Schematic representation of TNIP1 and the AHD mutant constructs.
(B) HeLa cells stably expressing mito-mKeima, FRB-FIS1 and FKBP-GFP-TNIP1 Full Length (FL) or FKBP-GFP-TNIP1 mutants ΔAHD1, ΔAHD3 and ΔAHD4 were treated with Rapalog for 24 h and subjected to FACS analysis. Left, representative FACS plot. Right, bar graph representing data as mean ± SEM obtained from 3 independent replicates.
(C) HeLa cells stably expressing mito-mKeima, FRB-FIS1 and FKBP-GFP-TNIP1 Full Length, LIR2 mutant, ΔAHD3 or LIR2 mutant and ΔAHD3 were treated with Rapalog for 24 h and subjected to FACS acquisition. Left, representative FACS plot. Right, bar graph representing data as mean ± SEM obtained from 3 independent replicates.
(D) Top, schematic representation of full length TNIP1 or the C-terminal and N-terminal part of TNIP1. Bottom, HeLa cells stably expressing mito-Keima, FRB-FIS1 and FKBP-GFP-TNIP1 full length or FKBP-GFP-TNIP1 N-terminal or C-terminal were treated with Rapalog for 24 h and subjected to FACS acquisition. Left, representative FACS plot. Right, bar graph representing data as mean ± SEM obtained from 3 independent replicates.
(E) HeLa cells stably expressing mito-Keima, FRB-FIS1 and FKBP-GFP-TNIP1 in wild type cells, PentaKO (SQSTM1, NBR1, NDP52, TAX1BP1 and TAX1BP1 KO cells), FIP200 KO, WIPI2KO or A20 KO cells were treated with Rapalog for 24 h and subjected to FACS analysis. Bar graph representing data as mean ± SEM obtained from 3 independent replicates.
(F) HeLa cells stably expressing mito-Keima, FRB-FIS1 and FKBP-GFP-ATG16L1, FKBP-GFP-WIPI2 or FKBP-GFP-A20 in wild type cells or TNIP1 KO cells were treated with Rapalog for 24 h and subjected to FACS analysis. Bar graph representing data as mean ± SEM obtained from 3 independent replicates.

