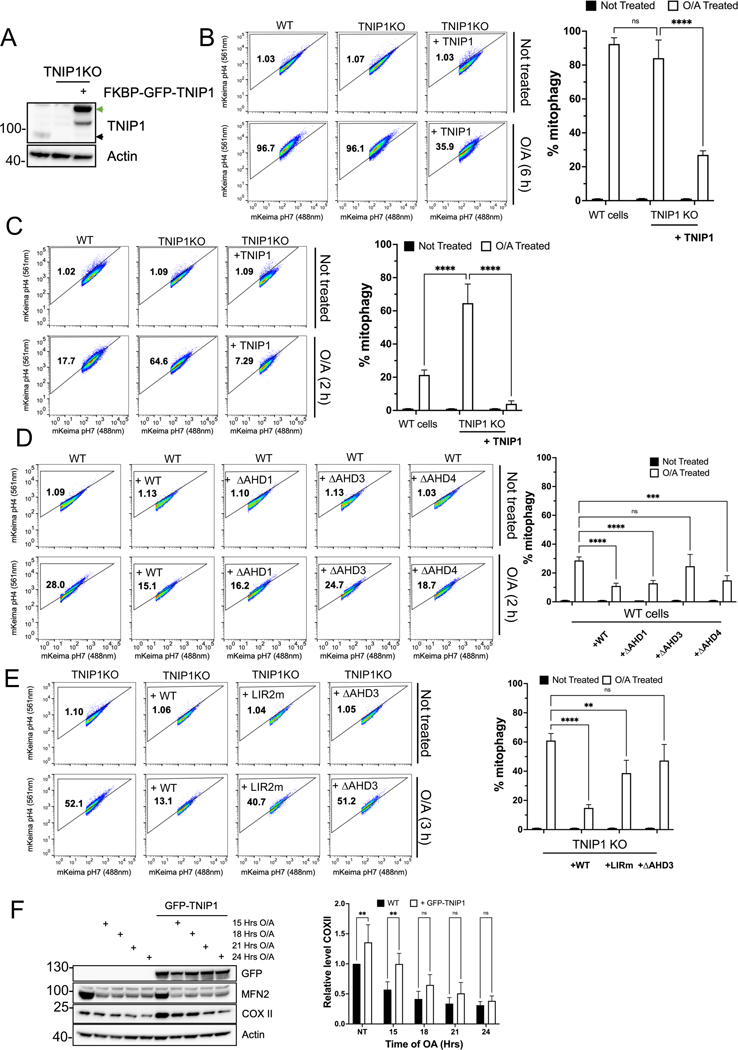
Fig. 3. TNIP1 is a negative regulator of selective autophagy.
(A) IB of HeLa cells, HeLa TNIP1 KO cells and HeLa TNIP1 KO rescued with FKBP-GFP-TNIP1. Green arrow, FKBP-GFP-TNIP1 construct. Black arrow, endogenous TNIP1.
(B) HeLa cells stably expressing mito-mKeima and HA-Parkin in wild type cells, TNIP1 KO cells or TNIP1 KO cells rescued with FKBP-GFP-TNIP1 construct were treated with Oligomycin and Antimycin (O/A) for 6 h and subjected to FACS analysis. Left, representative FACS plot. Right, bar graph representing data as mean ± SEM obtained from 3 independent replicates.
(C) HeLa cells stably expressing mito-mKeima and HA-Parkin in wild type cells, TNIP1 KO cells or TNIP1 KO cells rescued with FKBP-GFP-TNIP1 construct were treated with O/A for 2 h and subjected to FACS analysis. Left, representative FACS plot. Right, bar graph representing data as mean ± SEM obtained from 3 independent replicates.
(D) HeLa cells stably expressing mito-mKeima, HA-Parkin and overexpressing FKBP-GFP-TNIP1 wild type, ΔAHD1, ΔAHD3 or ΔAHD4 constructs were treated with O/A for 2 h and subjected to FACS analysis. Left, representative FACS plot. Right, bar graph representing data as mean ± SEM obtained from 3 independent replicates.
(E) HeLa TNIP1 KO cells stably expressing mito-mKeima, HA-Parkin and rescued with FKBP-GFP-TNIP1 wild type, LIR2 mutant or ΔAHD3 constructs were treated with O/A for 3 h and subjected to FACS analysis. Left, representative FACS plot. Right, bar graph representing data as mean ± SEM obtained from 3 independent replicates.
(F) IB of HeLa cells stably expressing BFP-Parkin and GFP-TNIP1 WT treated for 15 h, 18 h, 21 h or 24 h with O/A. Right, bar graph representing data as mean ± SEM obtained from 3 independent replicates.

