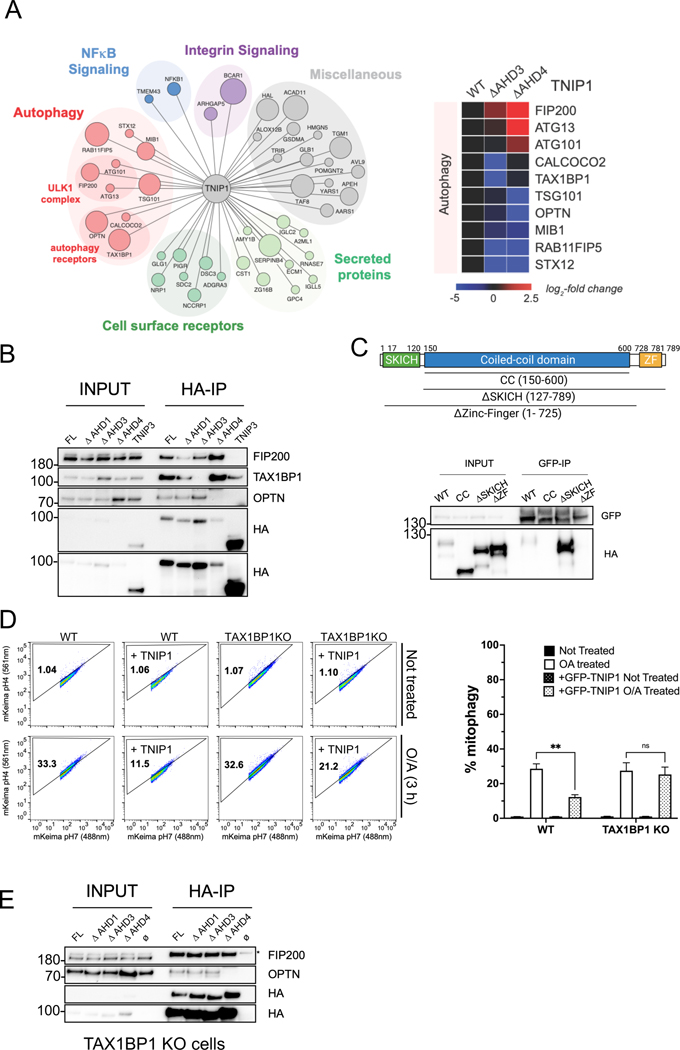
Fig. 4. The interaction between the AHD3 domain of TNIP1 and the Zinc-Finger domain of TAX1BP1 is necessary for TNIP1’s mitophagy inhibition.
(A) Left, High Confidence Candidate Interaction Proteins (HCIPs) network of HA-TNIP1 following an HA-pull down and mass spectrometry analysis. The size of the bait represents higher Z score interaction. Right, heat map of the interactors with wild type TNIP1 or ΔAHD3 and ΔAHD4 mutants.
(B) Co-IP and IB of HEK293T cells stably expressing HA-TNIP1 full length, ΔAHD1, ΔAHD3 and ΔAHD4 constructs or HA-TNIP3 using magnetic HA beads.
(C) Top, schematic representation of full length TAX1BP1 and the regions encompassing the coiled-coil domain (CC), SKICH truncation (ΔSKICH) and Zinc-Finger truncation (ΔZinc-Finger) constructs. Bottom, Co-IP and IB of HEK293T cells stably expressing GFP-TNIP1 full length and transiently expressing HA-TAX1BP1 full length, CC, ΔSKITCH and ΔZinc-Finger constructs using magnetic GFP beads.
(D) HeLa WT cells or TAX1BP1 KO stably expressing mito-mKeima, HA-Parkin and overexpressing FKBP-GFP-TNIP1 construct were treated with O/A for 3 h and subjected to FACS analysis. Left, representative FACS plot. Right, bar graph representing data as mean ± SEM obtained from 3 independent replicates.
(E) Co-IP and IB of HeLa TAX1BP1 KO cells stably expressing HA-TNIP1 full length or the ΔAHD1, ΔAHD3, ΔAHD4 constructs using magnetic HA beads. Ø: no overexpressed construct. * Marks unspecific band.

