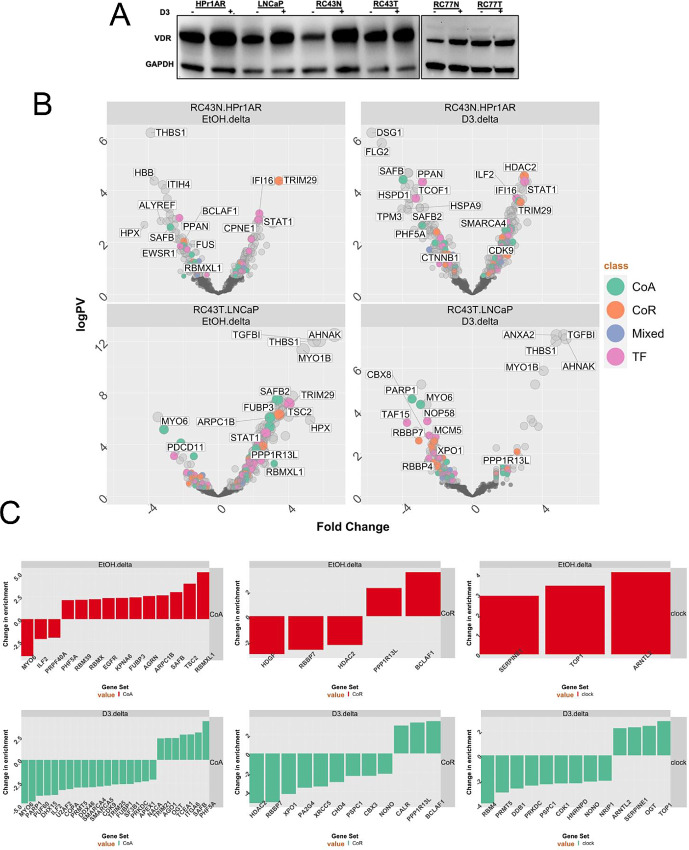
FIGURE 1.
Expression of VDR and responses to 1α,25(OH)2D3 in AA and EA cell lines. A, Western immunoblot measurements of VDR levels after 1α,25(OH)2D3 treatment (100 nmol/L, 24 hours) or vehicle control. B, RIME analyses of VDR in the indicated cells (in quadriplicates) and significantly different proteins were identified using an edgeR workflow. Volcano plots depicting enrichment levels, compared with IgG controls, between the indicated cells in basal or 1α,25(OH)2D3-stimulated conditions (100 nmol/L, 4 hours). Significant (Padj < 0.1) differentially and uniquely enriched proteins in each cell and treatment condition were classified either as a CoA, CoR, Mixed, or TF. C, The most altered components of the VDR complex were established in RC43T compared with LNCaP, and RC43N with HPr1AR, and then the delta between these comparisons were identified and ranked.

