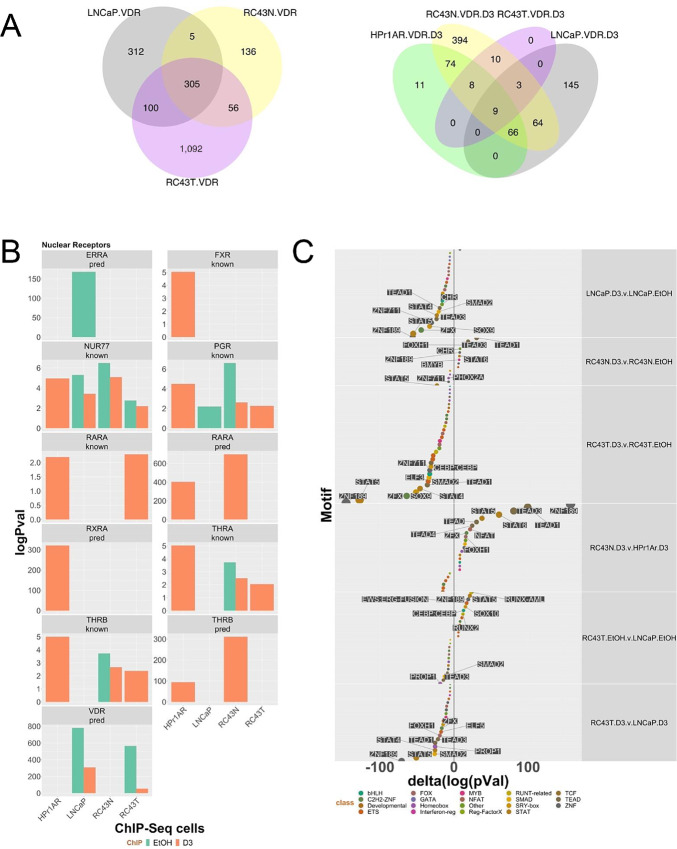
FIGURE 3.
VDR ChIP-seq in AA and EA cell lines. A, Basal and 1α,25(OH)2D3-stimulated (100 nmol/L, 6 hours) VDR ChIP-seq was undertaken in triplicate in HPr1AR, LNCaP, RC43N, and RC43T. FASTQ files were QC processed, aligned to hg38 (Rsubread), sorted and duplicates removed before differential enrichment of regions was measured with csaw and the significantly different regions compared with IgG controls (Padj < 0.1) were then intersected to generate the Venn diagrams of overlapping regions by a minimum of 1 bp (ChIPpeakAnno). B, Significantly differentially enriched motifs were identified by Homer and nuclear receptors are illustrated. C, Changes in motif enrichment were calculated (delta) and ranked by significance for visualization.

