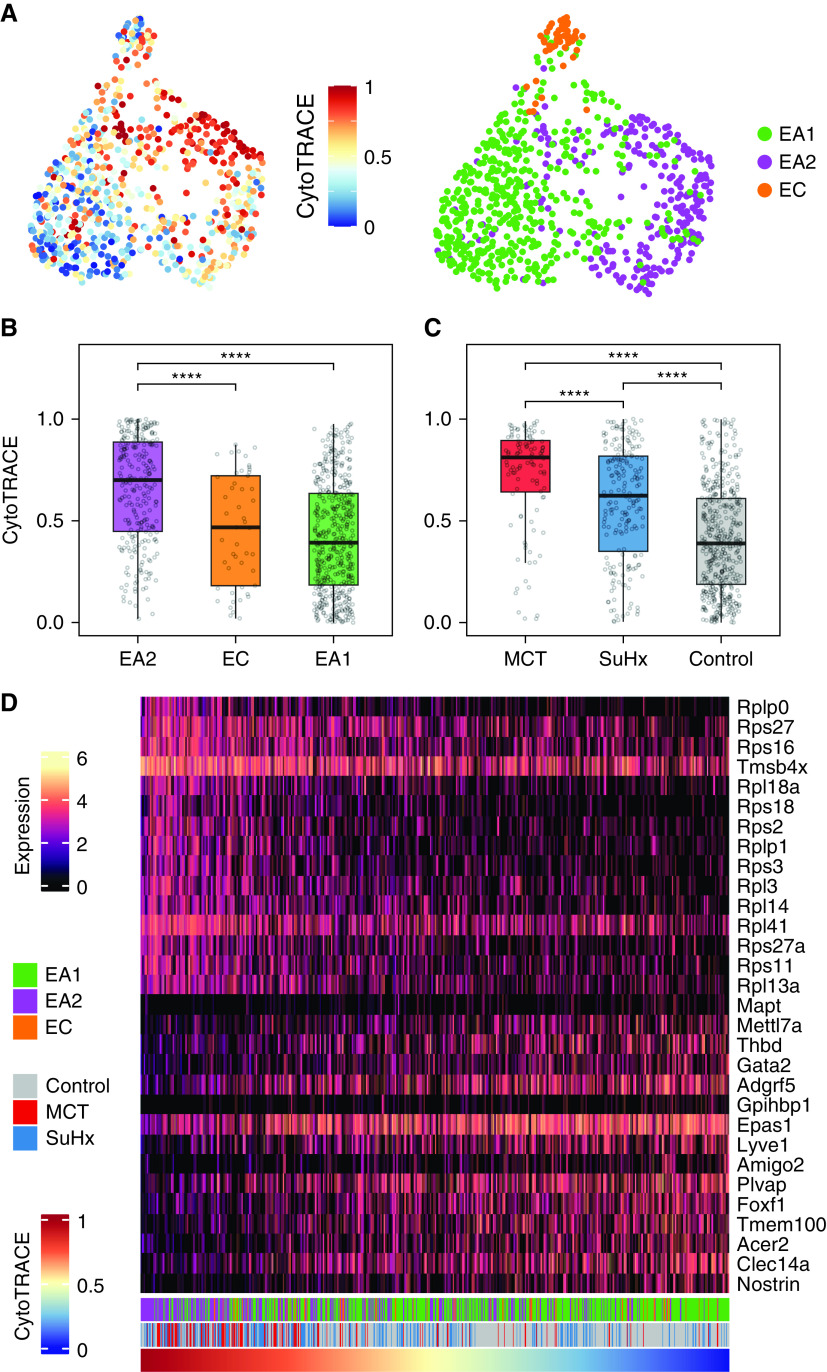
Figure 3.
Trajectory analysis reveals that EA2 has a stem/progenitor cell phenotype. (A) UMAP plots showing clustering of endothelial cells colored by cellular trajectory reconstruction analysis using gene counts and expression (CytoTRACE) score (left) and cell type (right). Higher CytoTRACE scores represent a less differentiated state. (B and C) Box plots comparing cell CytoTRACE scores grouped by (B) endothelial subpopulation and (C) disease condition. ****P < 0.0001 (Wilcoxon rank-sum test). (D) Heatmap showing normalized expression of top genes most positively or negatively correlated with cell CytoTRACE scores. Each column is a cell ordered from left to right by decreasing CytoTRACE scores. Cell annotations for cell type and condition are shown at the bottom. Amigo2 = adhesion molecule with Ig-like domain 2; CytoTRACE = cellular trajectory reconstruction analysis using gene counts and expression; Gata2 = GATA binding protein 2; Gpihbp1 = glycosylphosphatidylinositol anchored high density lipoprotein binding protein 1; Lyve1 = lymphatic vessel endothelial hyaluronan receptor 1; Mapt = microtubule-associated protein tau; Mettl7a = methyltransferase like 7A; Rpl18a = ribosomal protein L18A; Rplp = ribosomal protein lateral stalk; Rps = ribosomal protein S; Thbd = thrombomodulin; Tmem100 = transmembrane protein 100; Tmsb4x = thymosin beta 4, X-linked.

