Figure 5.

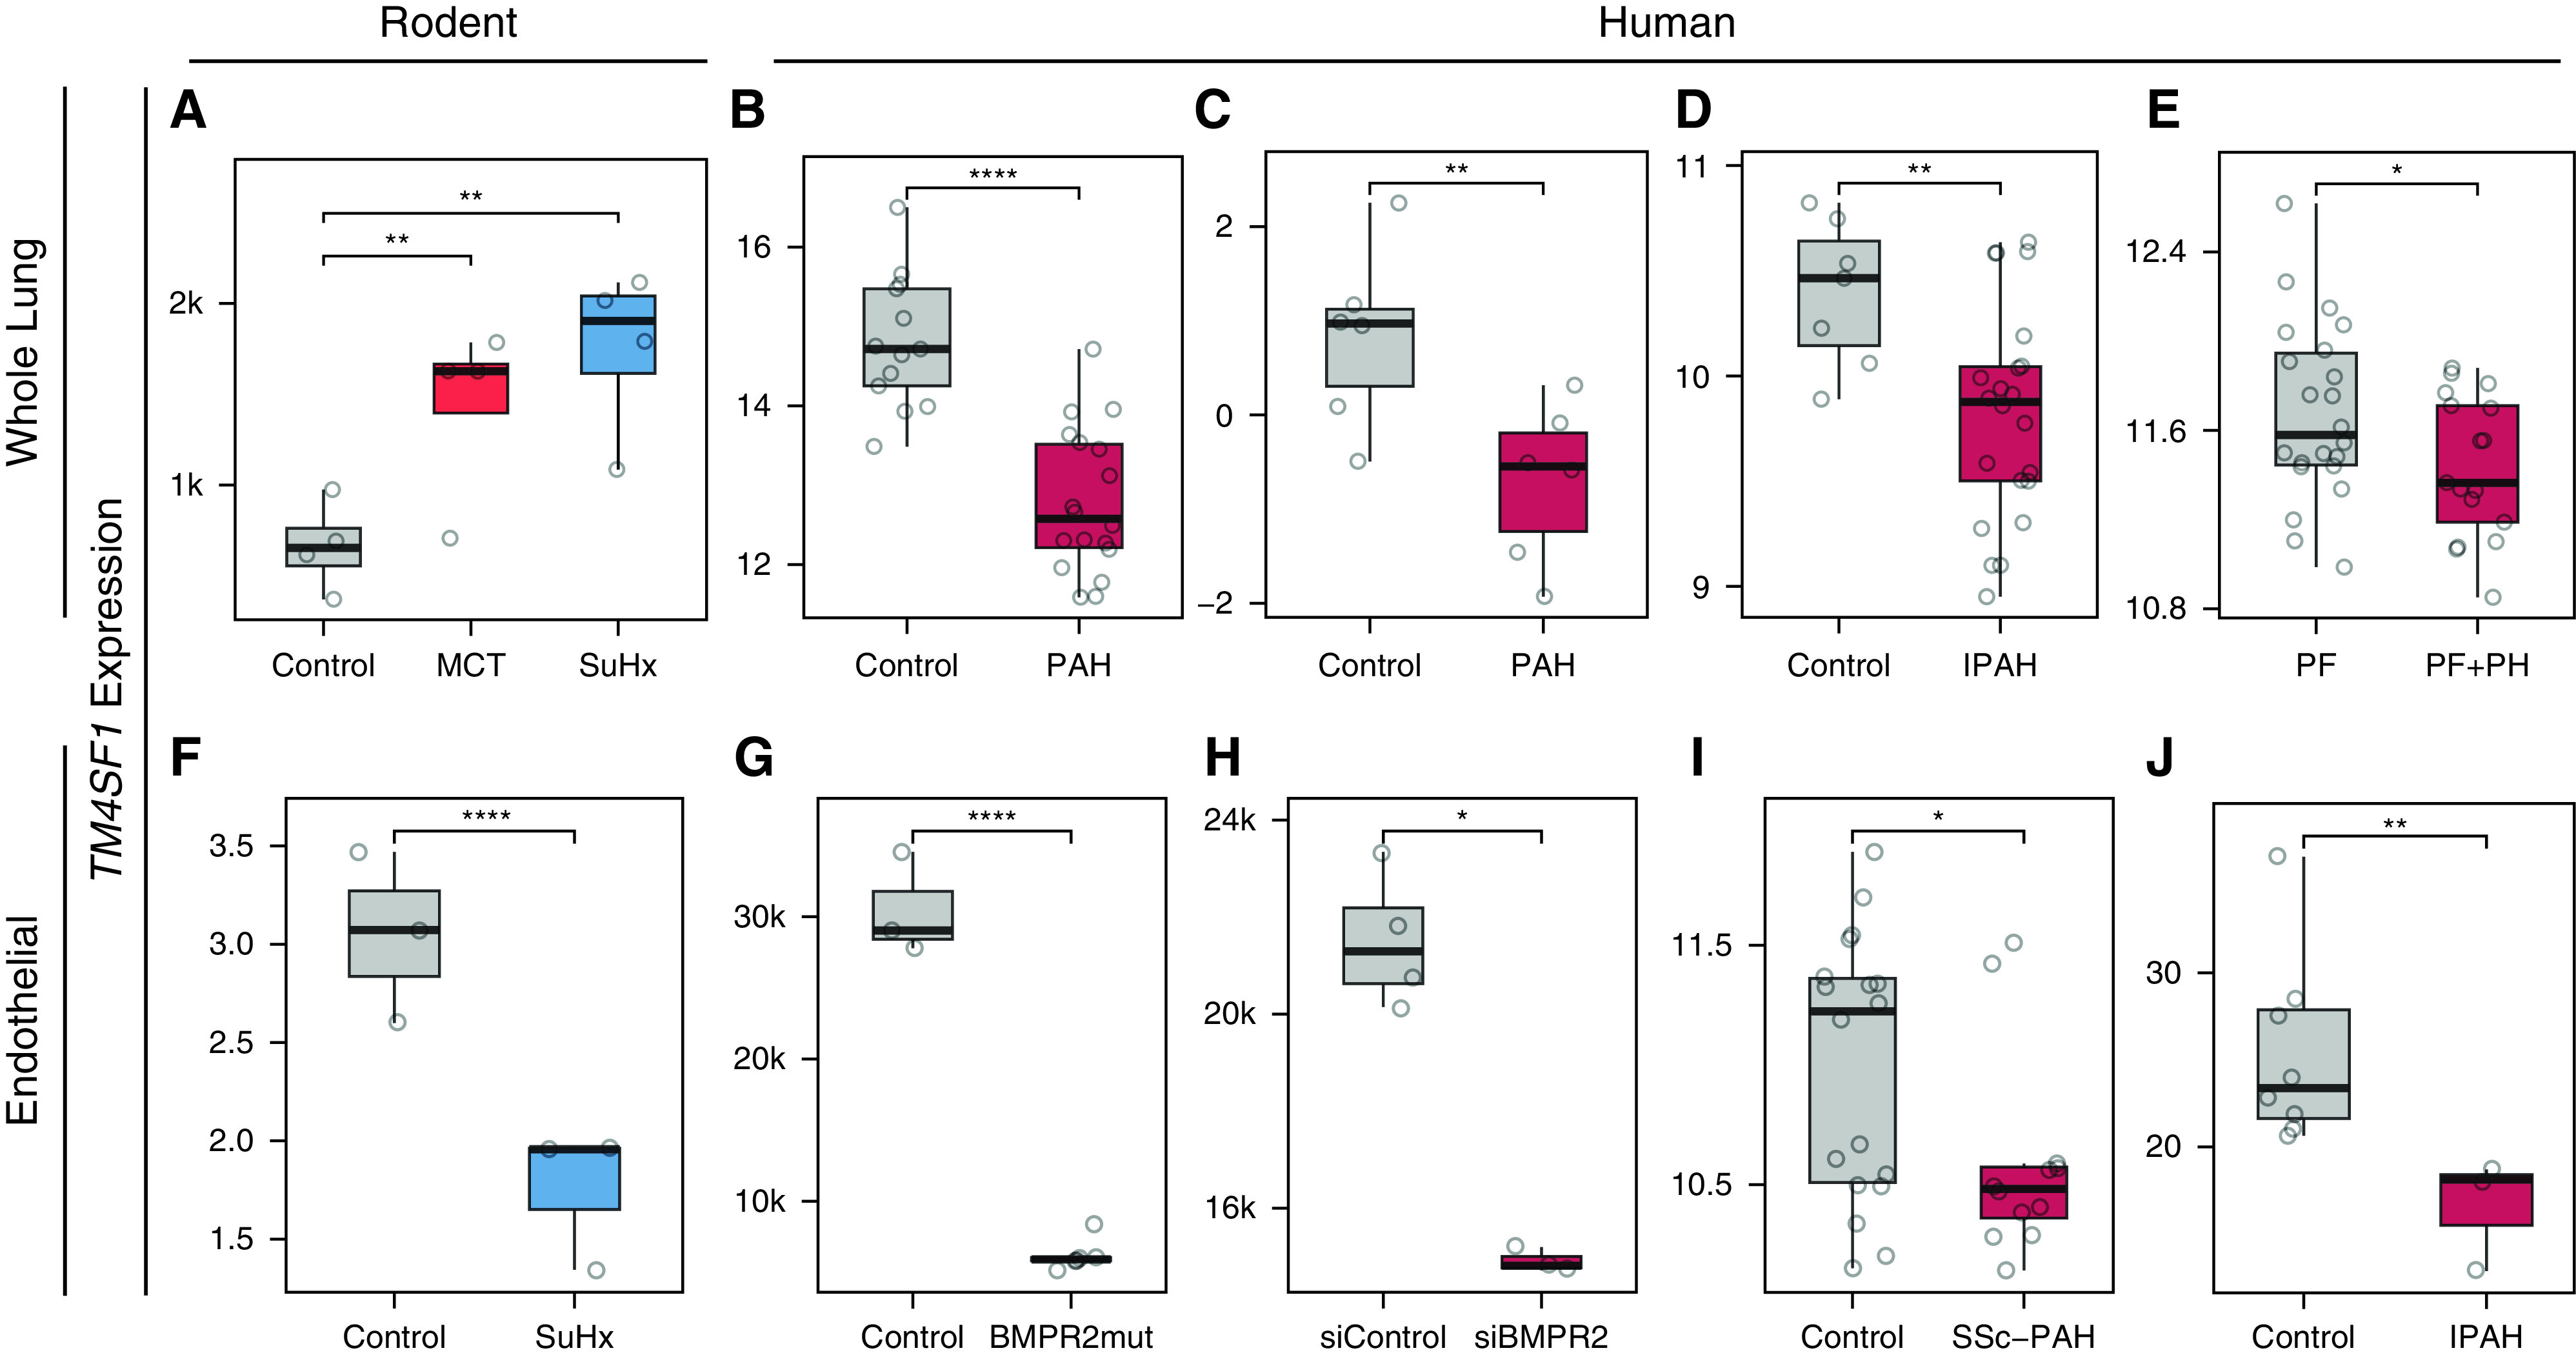
TM4SF1 is downregulated in the whole lung of patients with PAH and in endothelial cells from patients with PAH and models. (A) Box plot showing Tm4sf1 expression in control, MCT, and SuHx lungs by bulk RNA-seq (n = 4/group). (B–E) Box plots showing TM4SF1 expression in four independent human whole-lung microarray data sets: (B) 18 patients with PAH versus 13 control subjects (49), (C) 2 patients with PAH versus 2 control subjects profiled at three time points (0, 3, and 6 h) in an ex vivo lung perfusion study (Gene Expression Omnibus accession: GSE69416), (D) 22 female patients with idiopathic PAH versus 7 female control subjects (34), and (E) 17 patients with pulmonary fibrosis (PF) with severe pulmonary hypertension (PH) (mPAP > 40 mm Hg) versus 22 patients with PF without PH (mPAP < 20 mm Hg) (35). (F) Box plot showing expression of Tm4sf1 in a subcluster of 2,254 endothelial cells marked by Tm4sf1 from an scRNA-seq study of lung endothelial cells FACS purified from endothelial lineage-traced SuHx versus control mice (n = 3/group) (see Figure E6) (6). Expression is shown as an average across all cells within each animal. (G–J) Box plots showing TM4SF1 expression in four independent human endothelial data sets: (G) two CRISPR-generated BMPR2 mutants versus wild-type umbilical vein endothelial cells profiled by RNA-seq in three replicate in vitro experiments (36); (H) BMPR2- versus control siRNA–transfected pulmonary artery endothelial cells profiled by microarray in three and four replicate in vitro experiments, respectively (37); (I) endothelial progenitor cell–derived endothelial cells from peripheral blood of six patients with SSc-associated PAH and nine control subjects profiled by microarray at baseline and after hypoxic exposure in vitro (Gene Expression Omnibus accession: GSE73674); and (J) averaged expression of lung endothelial cells profiled by scRNA-seq from six PAH lungs versus three control subjects (5). P values were determined by DESeq2 for A and G; obtained from the National Center for Biotechnology Information’s Gene Expression Omnibus 2R for B–E, H, and I; and determined by Wilcoxon rank sum test for F and J: *P < 0.05 and **P < 0.01; ****FDR < 0.05. BMPR2mut = BMPR2 mutant; IPAH = idiopathic pulmonary arterial hypertension; mPAP = mean pulmonary arterial pressure; RNA-seq = RNA sequencing; siBMPR2 = BMPR2 siRNA; siControl = control siRNA.
