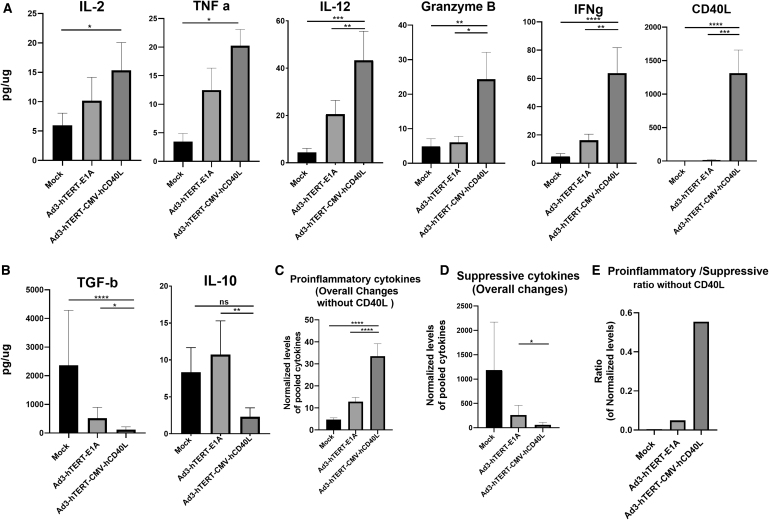
Figure 5.
Changes in cytokine profile in tumor histocultures. Patient histocultures were treated either with viruses or left uninfected. Supernatants were collected from histocultures on day 3 for analysis of IL-2, TNFa, IL-12, granzyme B, IFNg and CD40L, *normalized pooled proinflammatory cytokines (A), IL-10 and TGF-b1 normalized pooled immunosuppressive cytokines (B), normalized pooled proinflammatory cytokines overall changes without CD40L (C), normalized pooled suppressive cytokines overall changes (D). Of note, the word “overall changes” indicates all analyzed proinflammatory or suppressive cytokine changes (except CD40L). Ratio of proinflammatory (without CD40L) versus suppressive normalized pooled cytokine subsets (E). Cytokine concentrations were normalized against the total protein contents of the sample. Data are shown as mean + SEM (*p < 0.05; **p < 0.01, ***p < 0.001, ****p < 0.0001).

