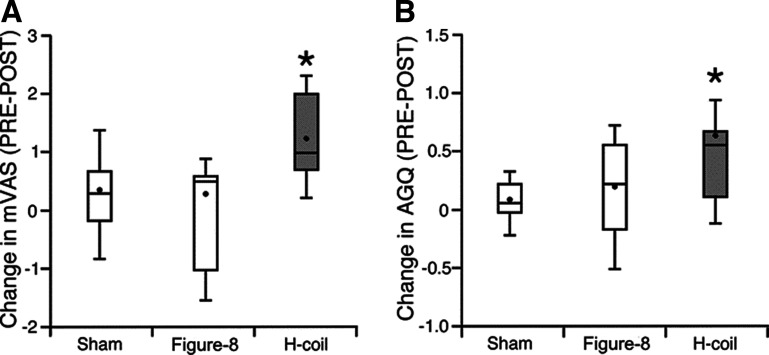
Figure 6.
Behavioral changes in motivation induced by the various stimulation coils (defined as PRE-POST). In each box of the mVAS (A) and AGQ (B) scores as measured by the questionnaires, the horizontal band indicates the group median, the dot indicates the group mean, and the whiskers define the extent of 1.5 times the interquartile range. Extended Data Figure 6-1 in the Extended Data shows detailed explanations of the questionnaires. Extended Data Figures 6-2 and 6-3 show analyses of these measures obtained in the preliminary feasibility study. *p < 0.05 between PRE and POST H-Coil stimulation.

