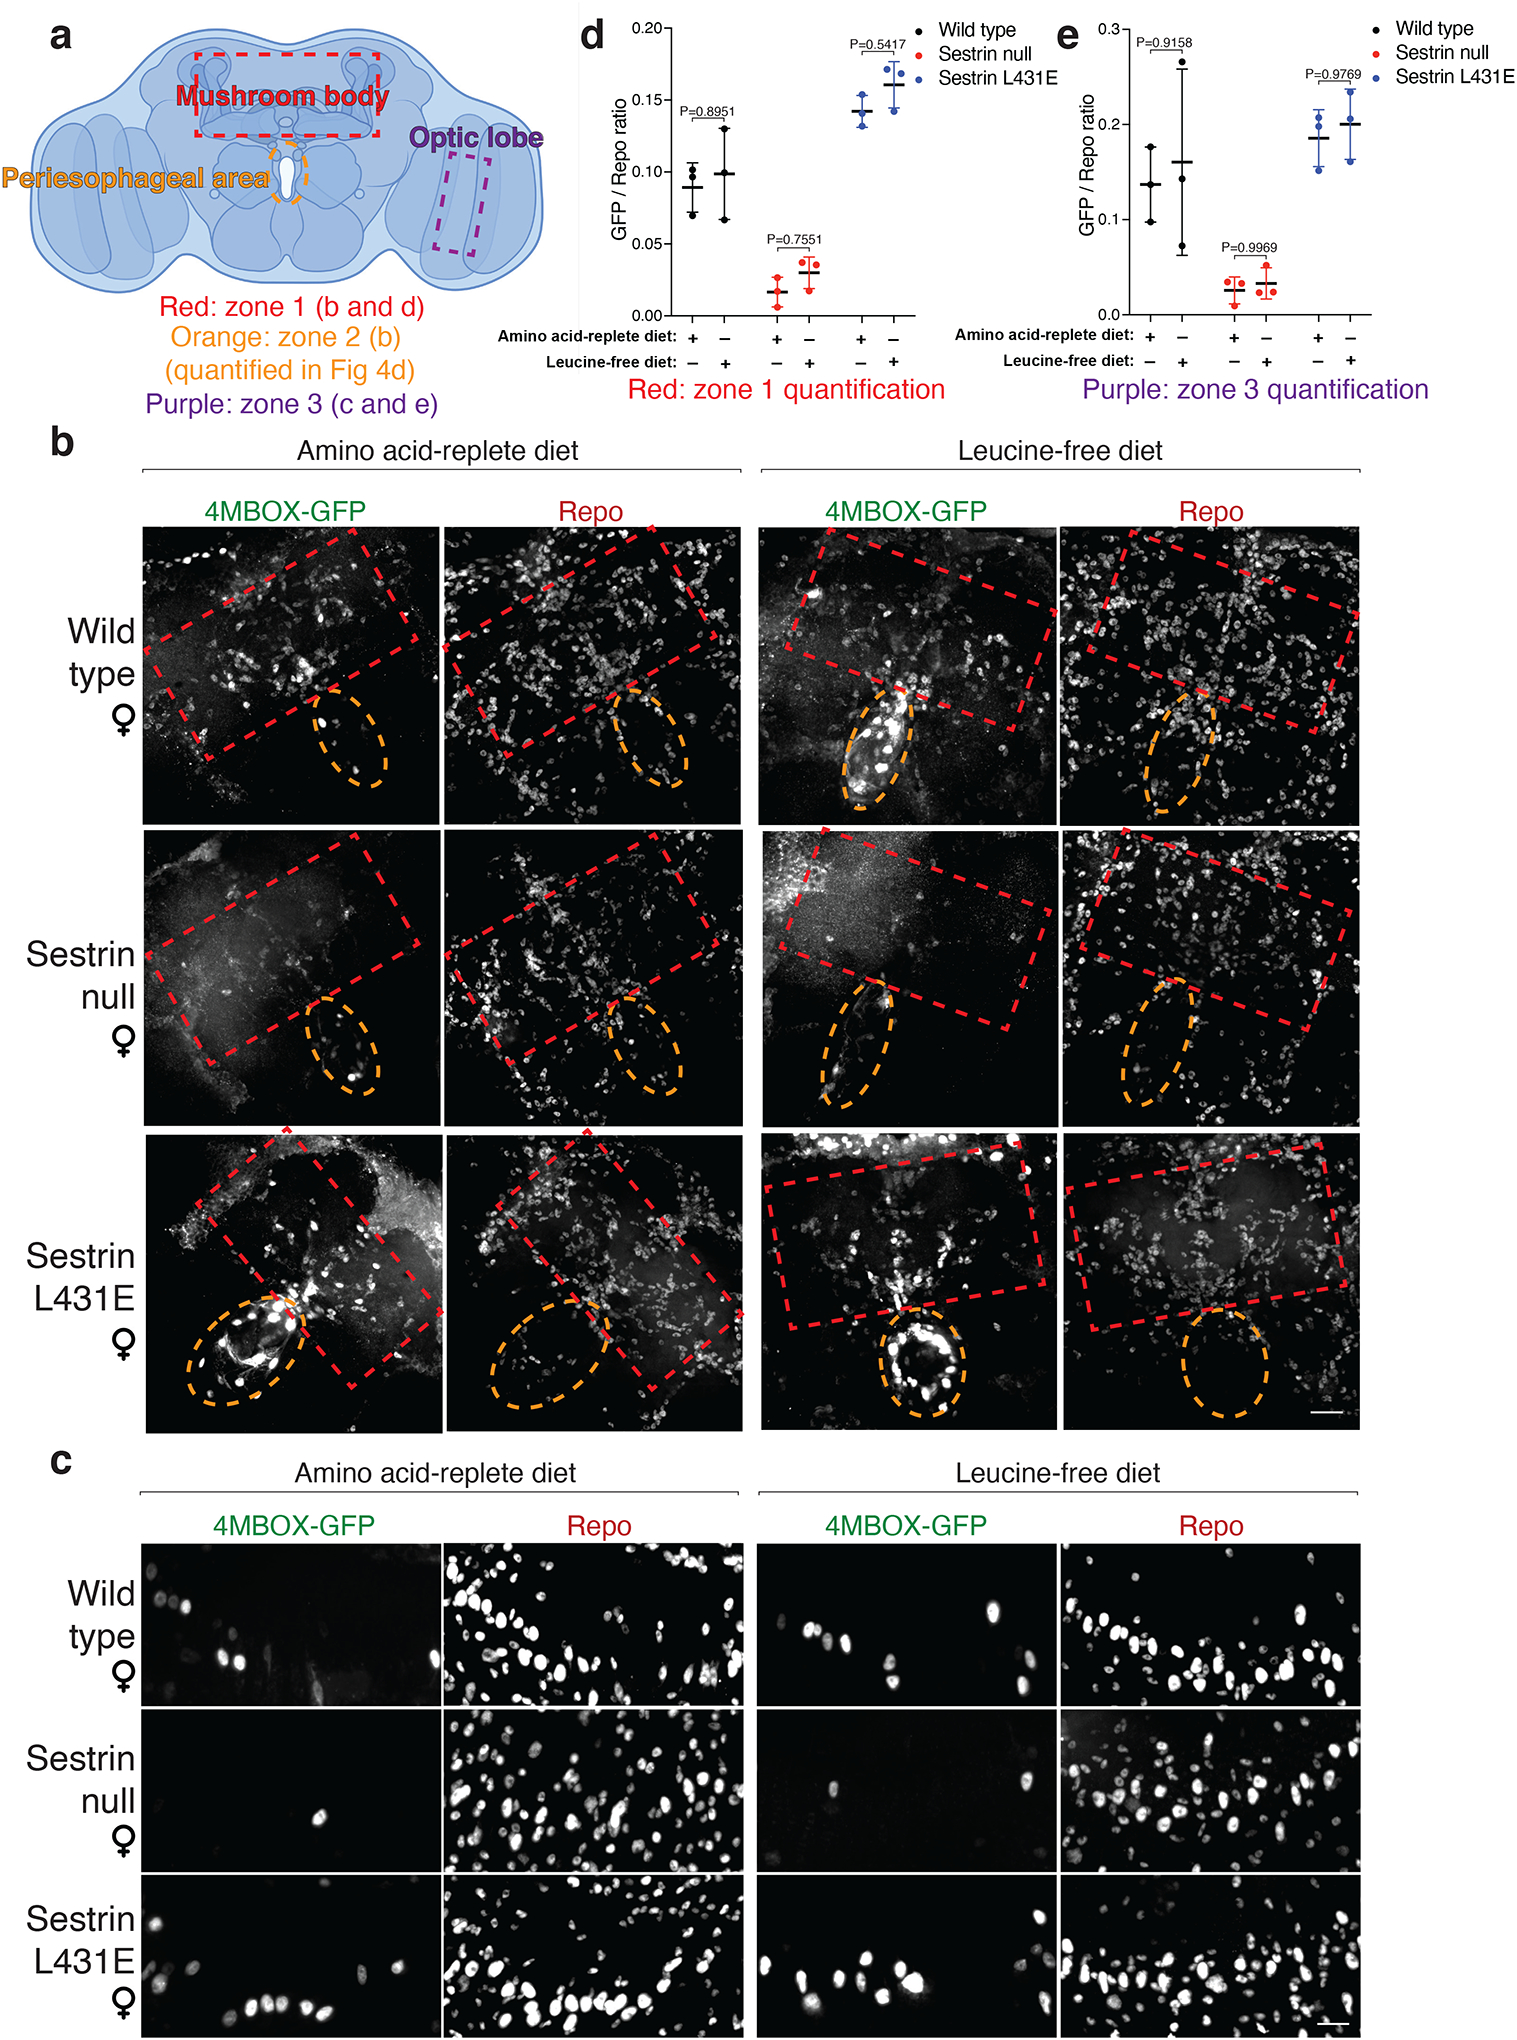
Extended Data Fig. 8: Dietary leucine regulates mTORC1 signaling in glial cells in the peri-esophageal area in a fashion that depends on Sestrin and its capacity to bind leucine.

a, Schematic of the areas imaged and quantified for the ratio of GFP-positive cells to Repo-positive cells. The red rectangle represents zone 1, the orange rectangle represents zone 2, and the purple rectangle represents zone 3.
b, Representative confocal images of zone 1 and zone 2 brain areas from wild-type, Sesn −/−, and SesnL431E female flies fed with an amino acid-replete or leucine-free diet. Scale bar, 25 μm. Note: images are reprocessed during revision from the same batch of samples as Figure 4c for the purpose of showing all zones 1, 2, and 3 clearly. The exact fly brains in the representative images and stacks might vary from Figure 4c, despite they are all from the same batch of samples.
c, Representative confocal images of zone 3 brain areas of wild-type, Sesn −/−, and SesnL431E female flies fed an amino acid-replete or leucine-free diet. Scale bar, 10 μm. Note: images are from the same brains shown in (b).
(a) created with BioRender.com. d, e, Quantification of the GFP-positive to Repo-positive ratio in zone 1 (d) and zone 3 (e). n=3 individual brains with indicated dietary treatment and genotype for each condition. Values are mean ± SD of biological replicates from a representative experiment. Data are representative of three independent experiments with similar results. Statistical analysis was performed using two-way ANOVA followed by Šídák’s multiple comparisons test.
