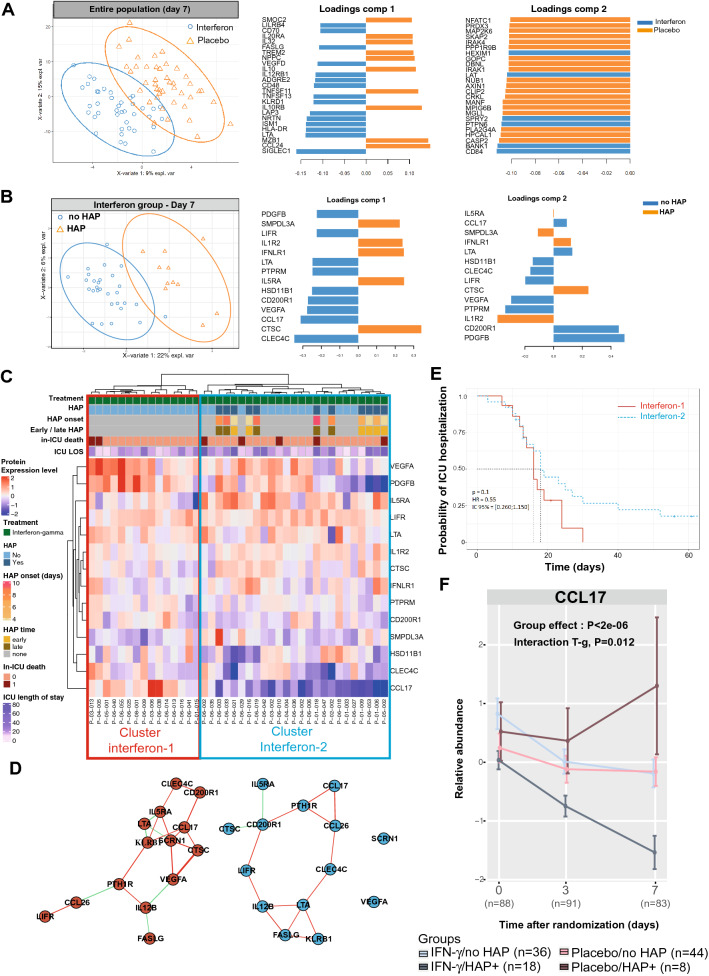
Fig. 2.
Time course of inflammatory profiles. A, ) PLSDA representations of the 384- inflammatory protein distributions on day 7 in (A) all the patients and (B) in the interferon-gamma group. C Unsupervised heatmap of the filtered proteins on day 7 in patients treated with interferon gamma. D Correlation network of the protein from clusters interferon-1 and interferon-2. E Kaplan–Meier estimates of the ICU hospitalization rate among patients of clusters interferon-1 and interferon-2. F Relative expressions of CCL17 in patients with or without HAP, treated with placebo or interferon gamma-1b. Data are presented as mean with standard error of mean. P-values calculated by linear mixed-effects models are reported in eTable 5. Interaction (T-g): Interaction between the effects of time and of groups (treatment)

