

Abstract
Background:
Patients with vestibular dysfunctions often experience visual-induced symptoms. Here we asked whether such visual dependence can be related to alterations in visual conscious awareness in these patients.
Methods:
To measure visual conscious awareness, we used the effect of motion-induced blindness (MIB,) in which the perceptual awareness of the visual stimulus alternates despite the characteristics of the physical stimulus remaining unchanged. In this phenomenon, a salient visual target spontaneously disappears and subsequently reappears from visual perception when presented against a moving visual background. The number of perceptual switches during the experience of the MIB stimulus was measured for 120 seconds in 15 healthy controls, 15 patients with vestibular migraine, 15 patients with benign positional paroxysmal vertigo (BPPV) and 15 with migraine without vestibular symptoms.
Results:
Patients with vestibular dysfunctions (i.e., both vestibular migraine and BPPV) exhibited increased perceptual fluctuation during MIB compared to healthy controls and migraine patients without vertigo. In VM patients, those with more severe symptoms exhibited higher fluctuations of visual awareness (i.e., positive correlation), whereas, in BPPV patients, those with more severe symptoms had lower fluctuations of visual awareness (i.e., negative correlation).
Implications:
Taken together, these findings show that fluctuations of visual awareness are linked to the severity of visual-induced symptoms in patients with vestibular dysfunctions, and distinct pathophysiological mechanisms may mediate visual vertigo in peripheral versus central vestibular dysfunctions.
Keywords: Vestibular Migraine, Visual Vertigo, BPPV, Visual Conscious Awareness
INTRODUCTION:
The brain must construct and continually update an accurate representation of the world by integrating visual inputs with other sensory cues. Previous psychophysical data suggests that in this process, each sensory cue is weighted in proportion to the reliability of its signals [1] [2] [3] [4] [5] [6] [7] [8]. This form of integration is generally considered beneficial for perceptual functions, as it can improve precision or contribute to adaptive behaviour. However, in situations when the different sensory systems conflict, it may lead to sensory misperception if the mismatch causes an overreliance on one or more sensory modalities [9].
Supporting this view is the observation that a significant number of patients with vestibular abnormalities go on to develop an overreliance on visual cues, leading to ‘visual dependency’ [10]. Consequentially, these patients may develop visual vertigo due to their high visual dependence, which manifests as spatial misperceptions or inappropriate postural responses in busy visual environments or with exposure to visual motion (e.g., supermarket aisles, busy train station, or fast-moving visual scenes) [11]. Such visual dependence can be also attributed to the re-weighting of the sensory inputs because of the reduced reliability of the vestibular signal and compensatory overreliance on visual inputs beyond the capacity to process or integrate this information into spatial perception [10] [11].
Visuospatial perception is a dynamic process that involves (i) alerting, which refers to the ability to remain vigilant of upcoming sensory signals, (ii) orientating, which refers to the ability to align attention with the salient source of sensory signals, and (iii) executive processing or resolving conflict, which refers to the ability to readily focus on a task and suppress peripheral distractors [12] [13]. These attentional mechanisms serve to make the incoming visual information more readily available for various perceptual or motor functions [12]. In this process, however, not all the visual inputs can reach the conscious state to become perceptually available and be reported [13]. Such gating of visual inputs has been studied by using paradigms in which the perceptual awareness of the visual stimulus fluctuates between different possible interpretations despite the characteristics of the physical stimulus remaining unchanged. In these paradigms, multistable precepts such as binocular rivalry or motion-induced blindness (MIB) are evoked because of fluctuation in the visual experience [14] [15]. During MIB, salient visual targets spontaneously disappear and subsequently reappear from visual perception when presented against a moving visual background [14]. Thus, while visual attention plays an important role in detecting visual information, another key aspect is the experience or ‘visual awareness’ of the stimulus, which can reflect how the incoming visual information is processed by the brain.
In a recent study, we used the attentional network task (ANT) to study attentional function in patients with episodic vestibular symptoms. Patients with vestibular migraine (VM) had deficits in their attentional network for resolving conflict or the ability to ignore peripheral distractors (i.e., increased reaction time) while they were able to stay vigilant and orientate to salient spatial information [16]. On the other hand, those with benign paroxysmal positional vertigo (BPPV) only showed a deficit in orienting, and not in other functional aspects of their visual attention [16]. With these distinct signs of altered visual attention in vestibular abnormalities, here we asked whether such changes are also reflected at the level of visual perception and whether the neural mechanisms related to visual awareness can be linked with the visual symptoms experienced by these patients. The results could therefore be helpful to distinguish the source of disabling visual symptoms reported by patients with vestibular dysfunctions.
To measure visual awareness, we used the effect of MIB in patients with vestibular symptoms. We recruited patients with VM and BPPV along with healthy individuals and those with migraine without vestibular symptoms as control groups. The severity of visual-induced symptoms was also measured to address whether it can be associated with fluctuations of visual awareness.
MATERIALS AND METHODS:
Participants:
Patients were recruited by Consultant Neuro-otologists at the Leicester Royal Infirmary. 15 VM patients (mean age 43.5 years; range 28–55; 10F; mean days since the last episode 32 days range 7–287 days) that conformed to the diagnostic criteria set out by both the Bárány Society and the 3rd edition of the International Classification of Headache Disorders (ICHD) were recruited [17]. We also recruited 15 patients with BPPV based on the diagnostic criteria for posterior canal BPPV (see for diagnostic criteria) [18] (mean age 57.7 years; range 36–67; 9F; mean days since last episode 17 days range 4–165 days). Critically, none of the BPPV patients had any previous or current history of either migraine or vestibular migraine. To control for non-specific effects of headache, we recruited 15 patients with migraine with aura but without vestibular symptoms (mean age 45.7; range 22–55; 11F; mean days since the last episode 29 days range 3–240 days) who conformed to the international classification of headache disorders ICHD-3 Beta clinical criteria for the diagnosis of migraine with typical aura [19] [20]. Fifteen healthy participants (mean age 47.8 years; range 28–52; 10F) as a non-disease control group were also recruited.
All participants were right-handed with normal vision and no history of past or current ophthalmological (this included normal visual acuity, binocular vision, no resting nystagmus at the time of testing, and no other oculomotor disorders such as impaired pursuit and saccadic dysmetria) or psychiatric disorders. There was i) no other neurological disorders in the migraine and VM groups, and ii) in the BPPV group no other otological disorders. All patients were newly diagnosed, and no one had chronic persistent symptoms. This also meant that at the time of testing none of the VM or migraine patients were taking any prophylaxis medication. However, all the migraine patients and 11/15 VM patients were taking analgesics including ibuprofen and paracetamol as needed. All VM and BPPV patients had normal (for age) hearing (assessed by pure tone audiogram) and vestibular function as assessed by the clinical vestibular evaluation. Experimental testing in both the migraine and VM group was performed in the interictal period when the patients were not acutely symptomatic. In BPPV patients, it was performed one hour after the treatment with repositioning manoeuvres. Written informed consent was obtained from each participant.
Motion-Induced Blindness stimulus:
The stimulus consisted of three yellow dots (0.2°) and a central green fixation dot arranged along a 1° radius circle forming a triangle (Figure 1). This was overlaid on a global clockwise-moving pattern of blue dots on a black background [16]. Subjects experienced the disappearance and reappearance of the yellow dots when fixated on the green dot during the 120-second viewing period. The stimulus was displayed on a 17” CRT display that was set at 600 by 800-pixel resolution and an 88Hz refresh rate. The screen was placed at a distance of 40cm from the subjects’ eyes. Participants indicated via a button press every time they experienced a change (i.e., either a disappearance or reappearance) in the number of perceived yellow dots.
Figure 1: Experimental methodology.
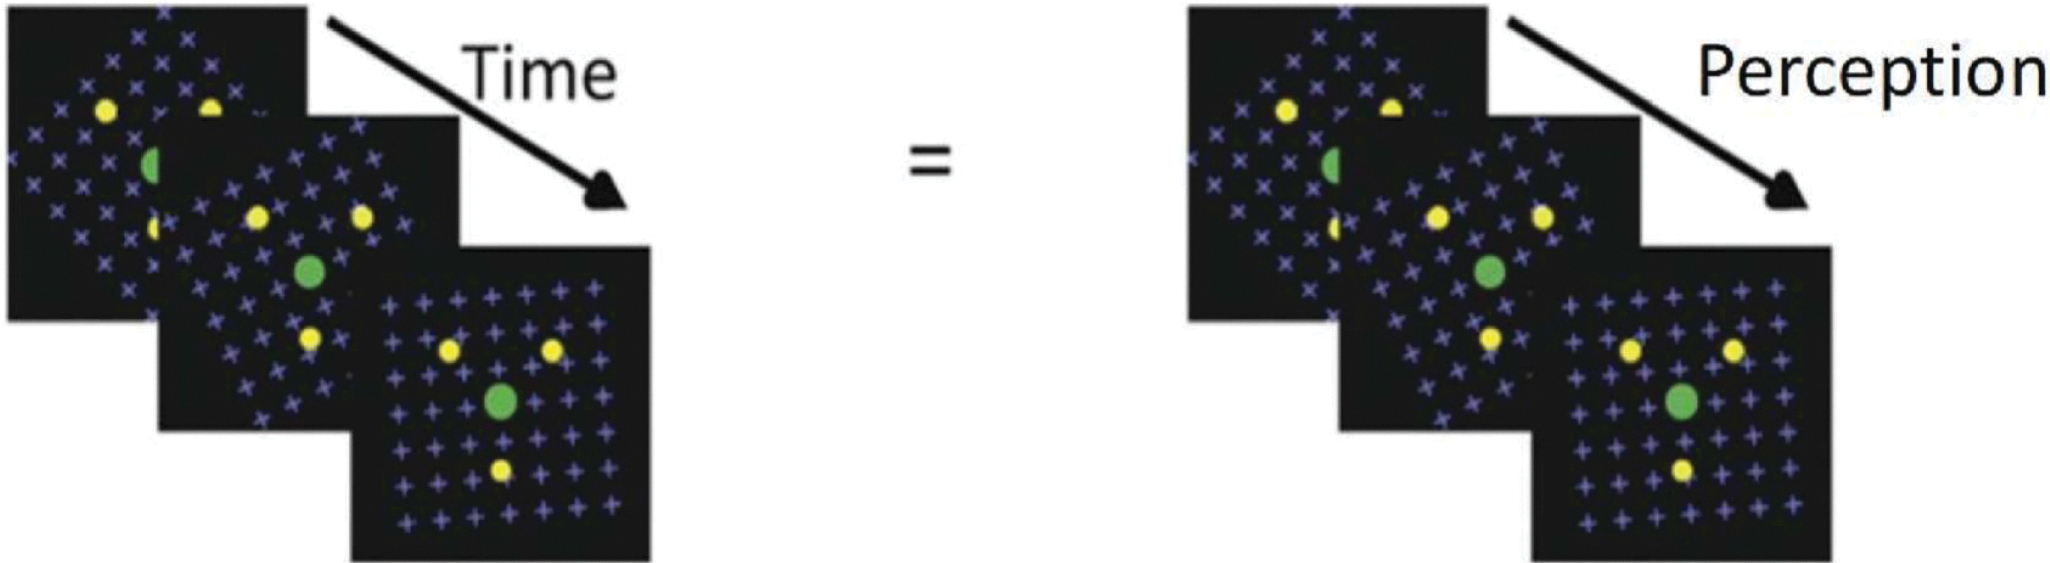
Stimulus used for the MIB task. Subjects viewed the green fixation dot and as time passed the perception changed for example from 2 dots to 3 dots and then none. Each time the subject reported a change they had to press a button to indicate this change.
Clinical questionnaires:
Visual symptoms were assessed with the Visual Vertigo Analogue Scale (VVAS). This is a 9-item Likert scale (range 0–10; 0 represents no dizziness and 10 represents the most dizziness) that assesses dizziness in different environmental conditions (e.g., walking through a supermarket aisle, walking over a patterned floor, or being under fluorescent lights) [21]. Participants also completed the Dizziness Handicap Inventory (DHI), a 25-item questionnaire to assess: physical (7 questions, 28 points), functional (9 questions, 36 points), emotional (9 questions, 36 points) factors associated with dizziness [22]. Given that visual perception can be modulated by anxiety, we used The Spielberger Trait and State Anxiety Inventory (short version) to control for the effect of anxiety and assess it both the day-to-day level (anxiety trait) and in response to the experimental protocol (situational or anxiety state), by taking pre- and post-experiment measures [23].
Data and Statistical analysis:
Perceptual transitions during MIB were measured as the switch rate per second in visual awareness over a period of two minutes via a button press. A one-way ANOVA was conducted for the average switching rate per second and subject group. Post-hoc t-test was performed using Bonferroni corrections. The total score for both the VVAS and DHI scale was calculated by summing the individual responses for each subject.
Control experiment for the potential confounding influence of eye movements:
Control experiments were run on an IBM PC with a 21-inch HP Trinition P1130 CRT monitor (Walnut, CA, USA) with a frame rate of 1000 Hz and resolution of 1,280 * 1,024 pixels. Stimulus presentation and timing were controlled using custom-built software in MATLAB (Mathworks, Natick, MA, USA) with Psychtoolbox (Brainard, 1997; Kleiner et al., 2007) and Eyelink (Cornelissen, Peters & Palmer, 2002) toolbox extensions. Viewing distance was fixed at 63 cm using a chin rest and pupil dilation and fixation were measured using an Eye-Link 1000 video-based eye tracker (SR Research Ltd., Ottawa, ON, Canada), with a spatial resolution of < 0.02 degrees and sample rate of 1000 Hz. The recordings were conducted in a dimly lit room at a constant light level for all participants. None of these participants were involved in the main study.
Trials started with a 9-point calibration sequence to ensure gaze location could be tracked with an accuracy <= 0.5°. Eye movements were recorded monocularly from the right eye. Deflections in eye position exceeding 0.1° with a minimum velocity of 22° / second and acceleration of 3800°/second2 were defined as saccades. Samples with missing data were classified as blinks, and gaze start and end locations below saccade thresholds as fixations. X and Y coordinates of saccades and fixations corresponded to pixel locations on the display. Following successful calibration and validation, the video was played in a rectangle centred on the display that subtended 27.08° × 18.80°. The video’s duration was 40 seconds and eye movements were recorded throughout the playback. Observers were instructed to maintain fixation at the centre of the display and report the number of times the yellow dots appeared or disappeared. Observers completed two trials separated by a rest period of 5 minutes.
For analysis of eye movements, mean X and Y gaze coordinates of fixations were transformed from pixels to visual angles in degrees. Euclidian distances between fixation coordinates and the centre of the display were computed as a measure of fixation stability for each observer across trials.
RESULTS
Motion Induced Blindness:
The MIB switch rate were 0.79±0.28 (mean± SD) in VM patients, 0.64±0.16 in BPPV patients, 0.51±0.10 migraine patients and 0.46±0.13 in healthy controls. There was a significant difference in the switching rate between groups as determined by the one-way ANOVA (F (3, 56) = 12.0, p < 0.001, ηp2 = .392). Bonferroni corrections post hoc comparisons revealed that there was a significant difference in switching rate between healthy controls and (i) vestibular migraine (p < 0.001), (ii) BPPV (p < 0.05), as well as a difference in switching rate between vestibular migraine and migraine patients (p ≤ 0.001) (Figure 2). There was no difference between migraine patients and healthy controls (p > 0.05), and vestibular migraine and BPPV (p > 0.05).
Figure 2: Results of the motion induced blindness task.
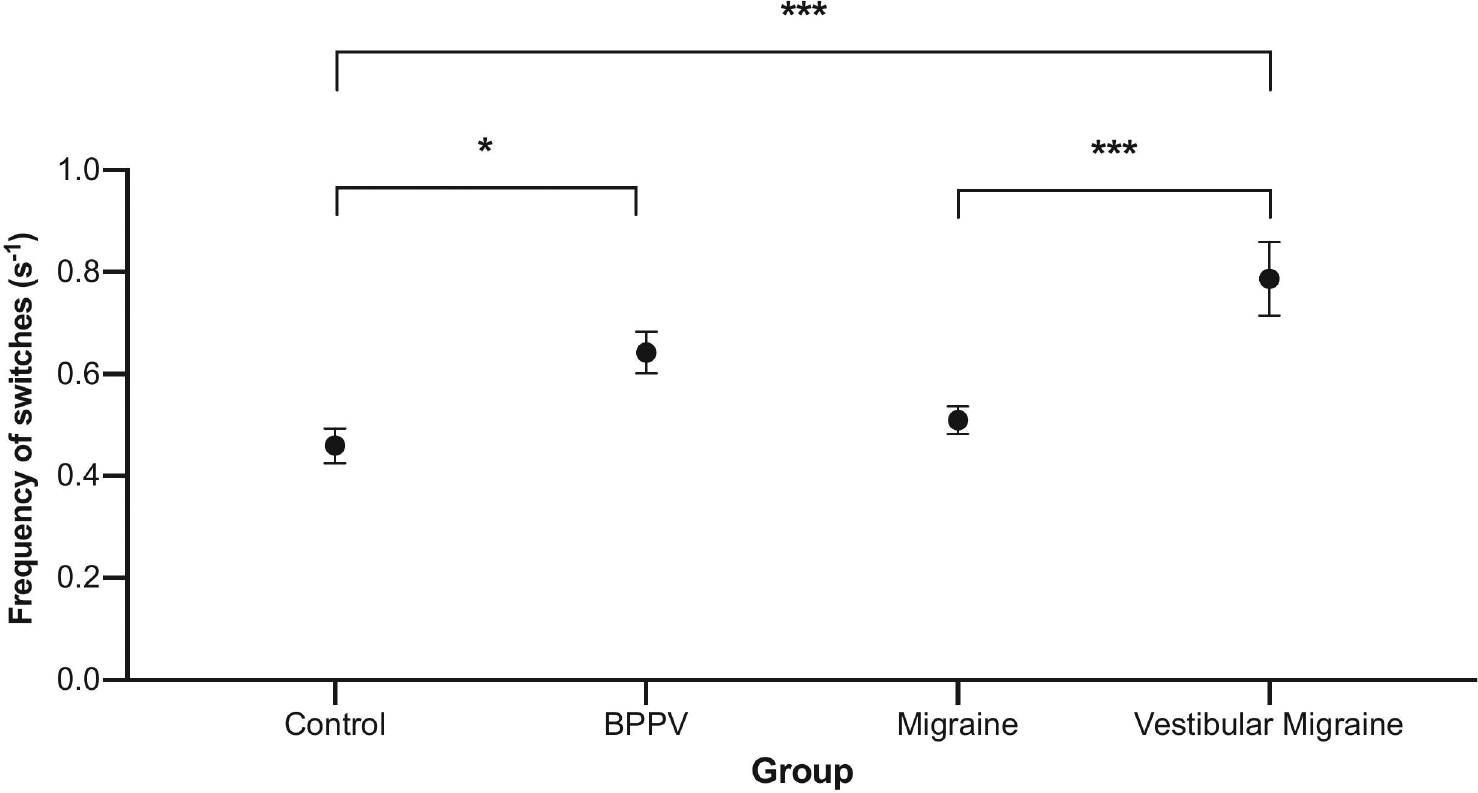
On the x-axis we represent the different participant groups, and, on the y-axis, we represent the frequency of switching rate per second. There was a significant difference in the average switching rate between healthy controls and (i) BPPV (p < 0.05), (ii) vestibular migraine (p < 0.001), and (iii) vestibular migraine and migraine patients (p < 0.01). Significance levels represented are * = p < 0.05, ** = p < 0.01, *** = p < 0.001; error bars represent SEM.
Symptom scales:
For ease of reference, these are summarised in Table 2. The average VVAS were 57.7 (range 10–90) in VM patients, 21.3 (range 0–50) in BPPV patients, 3.87 (range 0–20) in migraine patients, and 0 (range 0–0) in healthy control. The DHI scores were 59.2 (range 22–90) in VM patients, 44.7 (range 18–64) in BPPV patients, 1.3 in migraine patients (range 0–8) and 0 (range 0–0), in healthy controls. Statistical testing revealed that there were significant differences for both the DHI and VVAS between VM and BPPV (P<0.05 t-test), VM and migraine without vestibular symptoms (p<0.001) as well as for BPPV and migraine without vestibular symptoms (p<0.001).
Table 2.
Clinical characteristics and questionnaire scores of patients and healthy controls.
| Vestibular Migraine (n =15) | BPPV (n =15) | Migraine (n=15) | Control (n=15) | |||||
|---|---|---|---|---|---|---|---|---|
|
|
|
|
|
|||||
| Mean (SD) | Range | Mean (SD) | Range | Mean (SD) | Range | Mean (SD) | Range | |
|
|
|
|
|
|||||
| Age | 43.5 (8.54) | 28–55 | 57.7 (10.81) | 36–67 | 45.7 (10.75) | 22–55 | 47.8 (6.10) | 28–52 |
| VVAS | 57.7 | 10–90 | 21.3 (17.3) | 0–50 | 3.87 (7.07) | 0–20 | ||
| DHI | 59.2 (24.3) | 22–90 | 44.7 (18.2) | 18–64 | 1.3 (2.47) | 0–8 | ||
| Trait anxiety | 43.5 (10.9) | 26–64 | 43.6 (11.22) | 18–64 | 47.3 (8.39) | 35–60 | 34.7 (4.48) | 30–45 |
| State anxiety (before experiment) | 11.53 (3.2) | 6–18 | 10.1 (2.69) | 6–16 | 9.27 (2.96) | 5–16 | 6.73 (1.03) | 6–8 |
| State anxiety (after experiment) | 11.47 (3.28) | 6–18 | 9.93 (2.40) | 6–14 | 9.07 (2.96) | 5–16 | 6.73 (1.03) | 6–8 |
The trait anxiety scores were 43.5 (range 26–64) in VM patients, 43.6 (range 18–64) in BPPV patients, 47.3 (range 35–60) in migraine patients, and 34.7 (range 30–45) in healthy controls. The state anxiety scores measured before the experiment were 11.53 (range 6–18) in VM patients, 10.1 (range 6–16) in BPPV patients, 9.27 (range 5–16) in migraine patients, and 6.73 (range 6–8) in healthy controls. The post-experiment state anxiety scores were 11.47 (range 6–18) in VM patients, 9.93 (range 6–14) in BPPV patients, 9.07 (range 5–16) in migraine patients, and 6.73 (range 6–8) in healthy controls. There was no significant difference when comparing pre- and post-state or trait anxiety measures in any of the 3 patient groups (p-value > 0.05).
Relationship between MIB and symptoms:
In vestibular migraine patients, there was a positive correlation between the VVAS score and the MIB switch rate (Pearson correlation r = 0.835; p-value = 0.0001). In BPPV patients, however, there was a negative correlation between the VVAS score and the MIB switch rate (Pearson correlation r = 0.741; p-value = 0.0016) (Figure 3 & Table 3). There was no relationship between the VVAS score and the MIB switch rate in migraine patients (Pearson correlation r = 0.190; p-value = 0.50). No relationship was observed between the MIB switch rate and the DHI score in VM patients (Pearson correlation r = 0.213; p-value = 0.45), BPPV (Pearson correlation r = 0.103; p-value = 0.71), and migraine patients (Pearson correlation r = 0.172; p-value = 0.54).
Figure 3: Effect of vertigo severity on visual conscious awareness.
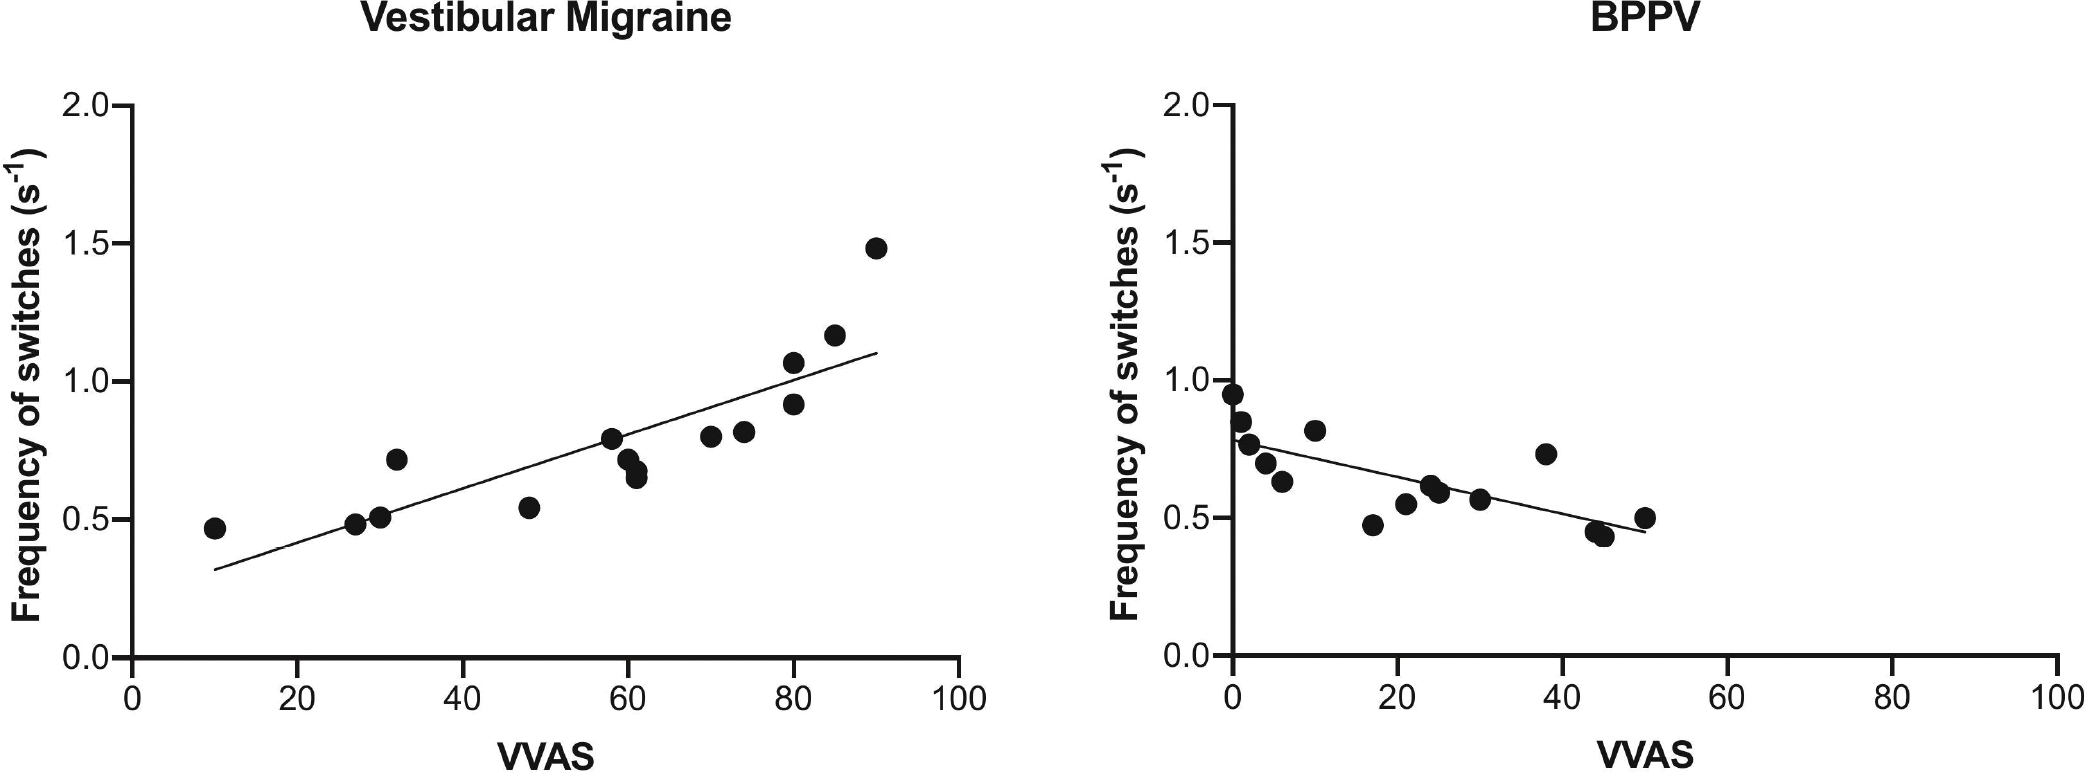
Here we show a significant positive correlation in vestibular migraine patients (Pearson correlation r = 0.835; p < 0.001) between the frequency of switches per second (y-axis) and VVAS score (x-axis), and a negative significant correlation in BPPV patients (Pearson correlation r = 0.741; p < 0.01).
Table 3.
Relationship between MIB switching rate and symptoms across the groups.
| Vestibular Migraine (n=15) | BPPV (n=15) | Migraine (n=15) | ||||
|---|---|---|---|---|---|---|
|
|
|
|
||||
| Pearson correlation (r) | P value | Pearson correlation (r) | P value | Pearson correlation (r) | P value | |
|
|
|
|
||||
| VVAS score and MIB switching rate | 0.835 | 0.0001 | 0.741 | 0.0016 | 0.190 | 0.50 |
| DHI score and MIB switching rate | 0.213 | 0.45 | 0.103 | 0.71 | 0.172 | 0.54 |
Eye movement control experiment:
As shown in Figure 4, we observed a similar pattern of fixations and deviations away from the central fixation dot in the three patient groups.
Fig 4:
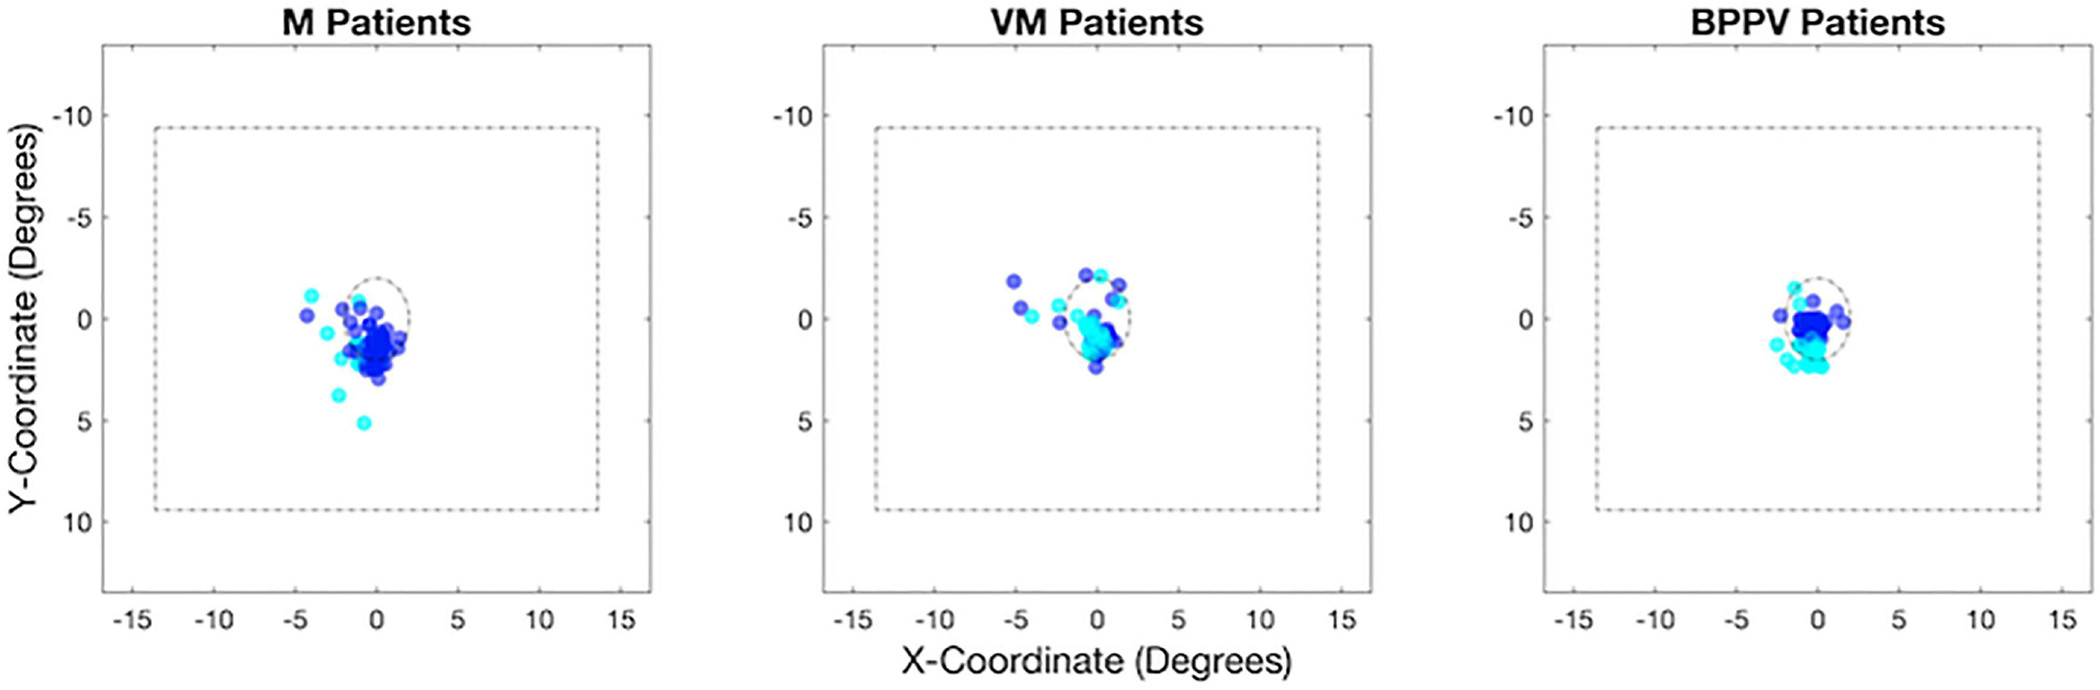
Distribution of fixations relative to the centre of the display (A) and mean fixation deviation by number of switches (B) for migraine without vertigo (M), vestibular migraine (VM) and BPPV patients.
DISCUSSION
In this study, we asked whether vestibular dysfunction could alter visual conscious awareness and whether such changes can be associated with the severity of visual-induced symptoms in these patients. Our findings reveal higher fluctuations of visual awareness in vestibular dysfunctions of either central (i.e., vestibular migraine) or peripheral (i.e., BPPV) aetiology when compared to healthy controls or migraine patients without vestibular symptoms. There was a dichotomous relationship between perceptual fluctuation and, visual-induced symptoms in these patients. That is, in VM patients, those with more severe symptoms exhibited higher fluctuations of visual awareness (i.e., positive correlation), whereas in BPPV patients those with more severe symptoms had lower fluctuations of visual awareness (i.e., negative correlation).
The fluctuations of visual awareness during MIB can be a valuable tool to study visual perception [13]. During this phenomenon, the neural functions that correlate with the perception alternate despite the characteristics of the physical visual stimulus remaining unchanged. In this scheme, a dissociation illustrates that not all the incoming visual information can be integrated into visual awareness by the perceptual mechanisms [14] [15]. Therefore, a higher rate of perceptual fluctuations in patients with vestibular dysfunction suggests that the attentional gating for the incoming visual information can be affected in these patients. This observation is in line with similar reports of increased perceptual fluctuations after vestibular stimulation with caloric responses or passive whole-body rotations in healthy individuals [24] [25] [26] [27]. Such modulation of visual perception by vestibular stimulation has been suggested to reflect the influence of vestibular inputs on processing visual information [27].
The dichotomy in the correlation between the perceptual fluctuation (i.e., the switch rate during MIB) and severity of symptoms implies different pathophysiological mechanisms for the visual induced symptoms in VM versus BPPV patients. The higher rate of perceptual fluctuation with more severe symptoms in VM suggests that the gating of visual attention or visual awareness is affected as part of the pathophysiology in this condition. On the other hand, the lower rate of perceptual fluctuation with more severe symptoms in BPPV suggests that the altered visual awareness is a compensatory mechanism in this patient group.
The higher rate of fluctuations of visual awareness for VM patients is directly in line with our recent study that showed that deficits in attentional processing are centred around the ability to resolve conflict and ignore peripheral distractors in these patients. Furthermore, this attentional deficit is also correlated with increased symptom load in these patients [16]. Contrastingly, in BPPV patients, we postulate that visual hypersensitivity develops because of central compensation which also results in sensory reweighting. Our recent research has recently demonstrated that reliance on visual information during sensory integration is driven by interhemispheric interactions between the parietal cortices, a key hub in vestibulo-cortical processing as well as for the processing of bistable percepts [28] [13]. Specifically, we observed that individuals with greater right hemispheric vestibulo-cortical dominance had increased reliance on vestibular cues during sensory integration (less visual dependence) [28]. Therefore, reduced visual symptoms in BPPV patients could be related to alterations in interhemispheric interactions that could in turn drive greater fluctuations of visual awareness. This latter point is supported by previous findings which also show that disruption of interhemispheric activity through non-invasive neuromodulation of the parietal cortex results in slower rates of fluctuation in visual awareness [26].
Unlike in VM, migraine patients without vestibular symptoms exhibited no differences in switching rate when compared to healthy controls, corroborating a previous report [29]. However, this observation is surprising given that a common feature in different phenotypes of migraine is hypersensitivity to sensory stimuli [30]. Previous research has shown that sensory hypersensitivity in migraine is independent of perception per se [31], and that different phenotypes of migraine can differentially modulate central vestibular pathways [32], which in turn can impact perceptual responses [33].
Before concluding, it is also important to note some potential limitations of the present study. Firstly, migraine and vertigo are often associated with co-morbid psychiatric symptoms (i.e., anxiety), which can modulate visual perception. Recent research has shown that a DHI score greater than 60 is unlikely to be caused solely by an organic pathology but rather signifies an increased likelihood of co-existing psychological co-morbidity (i.e., increased anxiety) [34]. In our cohort, this accounted for 3 out of the 15 VM patients, and 1 of the BPPV patients which could potentially have impacted upon switching rate. Reassuringly, the trait anxiety scores were comparable across all three patient groups in our study. Thus, the data disputes against the notion that the findings we present here may be significantly confounded by co-existing functional or psychiatric disorders. Secondly, previous research has shown that rates of micro-saccades /eyeblinks are linked with the number of perceptual transitions [35]. Thus, there is the possibility that fixational instability in the vestibular patients could have caused the observed increased switching, however, our control data using eye tracking in 15 healthy controls and 6 patients reassuringly revealed no differences between control and patients in measures of fixational stability when viewing the visual stimulus.
Taken together, the results of this study show that fluctuation in visual awareness is linked to the severity of visual-induced symptoms in patients with vestibular dysfunctions. We observed a dichotomy with a higher perceptual fluctuation with more severe symptoms in VM patients, but less severe symptoms in BPPV patients. These findings suggest distinct neural mechanisms may mediate visual-induced symptoms in peripheral versus central vestibular dysfunctions.
Table 1.
MIB switching rate across the groups.
| Vestibular Migraine (n =15) | BPPV (n =15) | Migraine (n=15) | Control (n=15) | |||||
|---|---|---|---|---|---|---|---|---|
|
|
|
|
|
|||||
| Mean | SD | Mean | SD | Mean | SD | Mean | Range | |
|
|
|
|
|
|||||
| MIB switch rate | 0.79 | ±0.28 | 0.64 | ±0.16 | 0.51 | ±0.10 | 0.46 | ±0.13 |
Highlights.
Vertigo alters visual conscious awareness
Vestibular migraine patients with more severe visual symptoms exhibit higher fluctuations of visual awareness
BPPV patients with more severe symptoms display lower fluctuations of visual awareness
Distinct mechanisms may mediate visual vertigo in peripheral versus central vestibular dysfunction
Acknowledgements:
We would like to thank all the patients at the Leicester Royal Infirmary as well as the healthy control participants, who kindly agreed to participate in this experiment.
Funding statement:
This work was supported by the Grant R01DC018815 from the National Institute on Deafness and other Communication Disorders.
Footnotes
Conflict of interest statement:
None of the authors report any conflict of interest.
Publisher's Disclaimer: This is a PDF file of an unedited manuscript that has been accepted for publication. As a service to our customers we are providing this early version of the manuscript. The manuscript will undergo copyediting, typesetting, and review of the resulting proof before it is published in its final form. Please note that during the production process errors may be discovered which could affect the content, and all legal disclaimers that apply to the journal pertain.
REFERENCES
- [1].Gu Y, DeAngelis GC, Angelaki DE. A functional link between area MSTd and heading perception based on vestibular signals. Nature neuroscience 2007; 10:1038–47. [DOI] [PMC free article] [PubMed] [Google Scholar]
- [2].Knill DC, Kersten D, Yuille A. Introduction. 1996:1–22. [Google Scholar]
- [3].Butler JS, Smith ST, Campos JL, Bülthoff HH. Bayesian integration of visual and vestibular signals for heading. Journal of vision (Charlottesville, Va.) 2010;10:23. [DOI] [PubMed] [Google Scholar]
- [4].de Winkel KN, Weesie J, Werkhoven PJ, Groen EL. Integration of visual and inertial cues in perceived heading of self-motion. Journal of vision (Charlottesville, Va.) 2010;10:1. [DOI] [PubMed] [Google Scholar]
- [5].Fetsch CR, DeAngelis GC, Angelaki DE. Visual-vestibular cue integration for heading perception: applications of optimal cue integration theory. The European journal of neuroscience 2010; 31:1721–9. [DOI] [PMC free article] [PubMed] [Google Scholar]
- [6].de Winkel KN, Soyka F, Barnett-Cowan M, Bülthoff HH, Groen EL, Werkhoven PJ. Integration of visual and inertial cues in the perception of angular self-motion. Exp Brain Res 2013; 231:209–18. [DOI] [PubMed] [Google Scholar]
- [7].Fetsch CR, DeAngelis GC, Angelaki DE. Bridging the gap between theories of sensory cue integration and the physiology of multisensory neurons. Nature reviews. Neuroscience 2013; 14:429–42. [DOI] [PMC free article] [PubMed] [Google Scholar]
- [8].Alberts BBGT, de Brouwer AJ, Selen LPJ, Medendorp WP. A Bayesian Account of Visual–Vestibular Interactions in the Rod-and-Frame Task. eNeuro 2016;3: ENEURO.0093-16.2016. [DOI] [PMC free article] [PubMed] [Google Scholar]
- [9].Frank SM, Pawellek M, Forster L, Langguth B, Schecklmann M, Greenlee MW. Attention Networks in the Parietooccipital Cortex Modulate Activity of the Human Vestibular Cortex during Attentive Visual Processing. J Neurosci 2019; 40:1110. [DOI] [PMC free article] [PubMed] [Google Scholar]
- [10].Guerraz M, Yardley L, Bertholon P, Pollak L, Rudge P, Gresty MA, Bronstein AM. Visual vertigo: symptom assessment, spatial orientation, and postural control. Brain (London, England: 1878) 2001;124:1646–56. [DOI] [PubMed] [Google Scholar]
- [11].Bronstein AM. Visual vertigo syndrome: clinical and posturography findings. Journal of neurology, neurosurgery, and psychiatry 1995;59:472–6. [DOI] [PMC free article] [PubMed] [Google Scholar]
- [12].Corbetta M, Shulman GL. Control of goal-directed and stimulus-driven attention in the brain. Nature reviews. Neuroscience 2002; 3:201–15. [DOI] [PubMed] [Google Scholar]
- [13].Koch C, Massimini M, Boly M, Tononi G. Neural correlates of consciousness: progress and problems. Nat Rev Neurosci 2016; 17:307. [DOI] [PubMed] [Google Scholar]
- [14].Bonneh YS, Cooperman A, Sagi D. Motion-induced blindness in normal observers. Nature 2001; 411:798–801. [DOI] [PubMed] [Google Scholar]
- [15].Lumer E, Friston K, Rees G. Neural Correlates of Perceptual Rivalry in the Human Brain. 1998. [DOI] [PubMed] [Google Scholar]
- [16].Bonsu AN, Britton Z, Asif Z, Sharif M, Kaski D, Kheradmand A, Bronstein AM, Arshad Q. Migraine phenotype differentially modulates the attentional network: A cross sectional observation study. Cephalalgia reports 2022; 5:251581632211242. [Google Scholar]
- [17].Lempert T, Olesen J, Furman J, Waterston J, Seemungal B, Carey J, Bisdorff A, Versino M, Evers S, Kheradmand A, Newman-Toker D. Vestibular migraine: Diagnostic criteria (Update)1. VES 2022; 32:1. [DOI] [PMC free article] [PubMed] [Google Scholar]
- [18].Von Brevern M, Bertholon P, Brandt T, Fife T, Imai T, Nuti D, Newman-Toker D. Benign paroxysmal positional vertigo: diagnostic criteria. Journal of Vestibular Research 2015; 25:105–17. [DOI] [PubMed] [Google Scholar]
- [19].Silberstein SD, Olesen J, Bousser MG, Diener HC, Dodick D, First M, Goadsby PJ, Göbel H, Lainez M, Lance JW. The International Classification of Headache Disorders, (ICHD-II) —-Revision of Criteria for 8.2 Medication-Overuse Headache. Cephalalgia 2005; 25:460–5. [DOI] [PubMed] [Google Scholar]
- [20].Levin M The international classification of headache disorders, (ICHD III)–changes and challenges. Headache: The Journal of Head and Face Pain 2013; 53:1383–95. [Google Scholar]
- [21].Dannenbaum E, Chilingaryan G, Fung J. Visual vertigo analogue scale: an assessment questionnaire for visual vertigo. Journal of vestibular research 2011; 21:153–9. [DOI] [PubMed] [Google Scholar]
- [22].Jacobson GP, Newman CW. The development of the dizziness handicap inventory. Archives of Otolaryngology–Head & Neck Surgery 1990; 116:424–7. [DOI] [PubMed] [Google Scholar]
- [23].Cd S, Charles D. State-trait anxiety inventory. 2010.
- [24].Miller SM, Liu GB, Ngo TT, Hooper G, Riek S, Carson RG, Pettigrew JD. Interhemispheric switching mediates perceptual rivalry. Current Biology 2000; 10:383–92. [DOI] [PubMed] [Google Scholar]
- [25].Ngo TT, Liu GB, Tilley AJ, Pettigrew JD, Miller SM. Caloric vestibular stimulation reveals discrete neural mechanisms for coherence rivalry and eye rivalry: A meta-rivalry model. Vision Research 2007; 47:2685–99. [DOI] [PubMed] [Google Scholar]
- [26].Carmel D, Walsh V, Lavie N, Rees G. Right parietal TMS shortens dominance durations in binocular rivalry. Current Biology 2010;20: R799–800. [DOI] [PubMed] [Google Scholar]
- [27].van Elk M, Blanke O. Balancing bistable perception during self-motion. Experimental brain research 2012; 222:219–28. [DOI] [PubMed] [Google Scholar]
- [28].Arshad Q, Ortega MC, Goga U, Lobo R, Siddiqui S, Mediratta S, Bednarczuk NF, Kaski D, Bronstein AM. Interhemispheric control of sensory cue integration and self-motion perception. Neuroscience 2019; 408:378–87. [DOI] [PubMed] [Google Scholar]
- [29].Wilkinson F, Karanovic O, Wilson HR. Binocular rivalry in migraine. Cephalalgia 2008; 28:1327–38. [DOI] [PubMed] [Google Scholar]
- [30].Goadsby PJ, Holland PR, Martins-Oliveira M, Hoffmann J, Schankin C, Akerman S. Pathophysiology of migraine: a disorder of sensory processing. Physiol Rev 2017. [DOI] [PMC free article] [PubMed] [Google Scholar]
- [31].Noseda R, Kainz V, Jakubowski M, Gooley JJ, Saper CB, Digre K, Burstein R. A neural mechanism for exacerbation of headache by light. Nat Neurosci 2010; 13:239–45. [DOI] [PMC free article] [PubMed] [Google Scholar]
- [32].Russo A, Marcelli V, Esposito F, Corvino V, Marcuccio L, Giannone A, Conforti R, Marciano E, Tedeschi G, Tessitore A. Abnormal thalamic function in patients with vestibular migraine. Neurology 2014; 82:2120–6. [DOI] [PubMed] [Google Scholar]
- [33].Bednarczuk NF, Bonsu A, Ortega MC, Fluri A, Chan J, Rust H, de Melo F, Sharif M, Seemungal BM, Golding JF. Abnormal visuo-vestibular interactions in vestibular migraine: a cross sectional study. Brain 2019; 142:606–16. [DOI] [PMC free article] [PubMed] [Google Scholar]
- [34].Graham MK, Staab JP, Lohse CM, McCaslin DL. A comparison of dizziness handicap inventory scores by categories of vestibular diagnoses. Otology & Neurotology 2021; 42:129–36. [DOI] [PubMed] [Google Scholar]
- [35].Hsieh P, Tse PU. Microsaccade rate varies with subjective visibility during motion-induced blindness. PLoS One 2009;4: e5163. [DOI] [PMC free article] [PubMed] [Google Scholar]