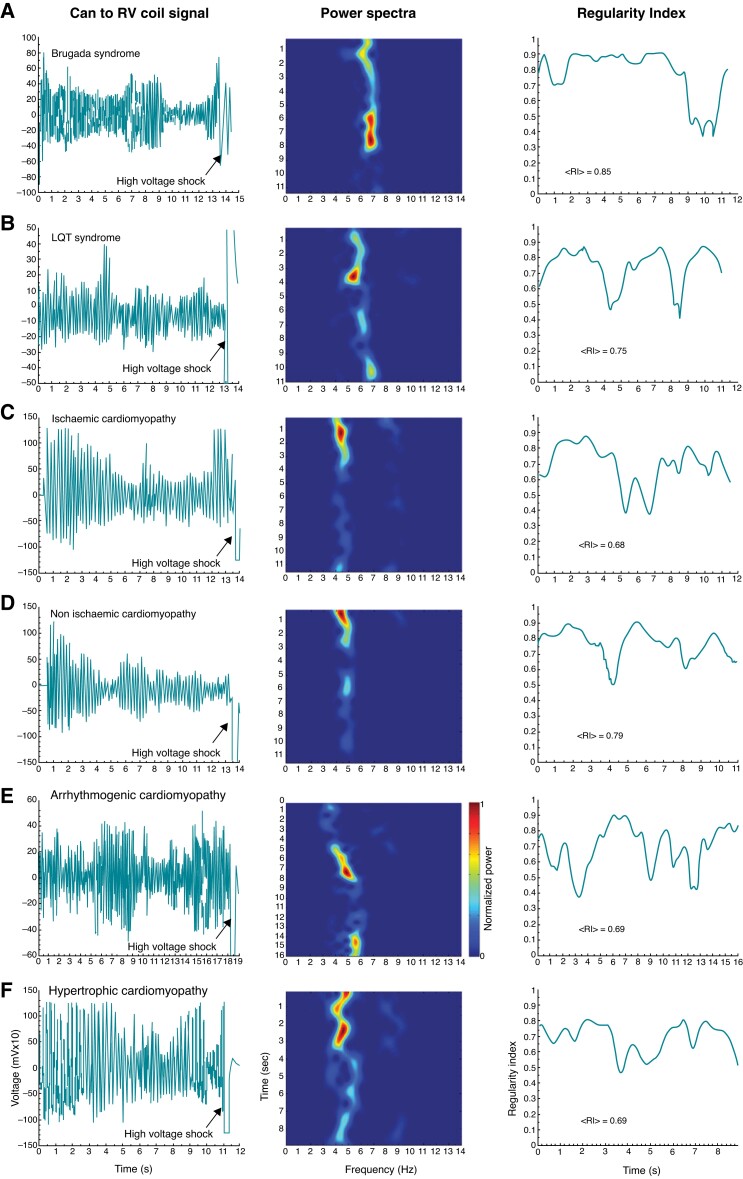
Figure 1.
Time course of voltage recordings and spectral parameters of PVT/VF episodes terminated by shock in various cardiac diseases. Panels A–F illustrate representative PVT/VF dynamics for each specified cardiac disease. Left, voltage recorded between the ICD can and the RV coil. Middle: Periodogram for moving 2 s long windows across the voltage time course. Y axis: time of starting of each moving window, X axis: frequency. Colour scale: Normalized power from blue (minimum) to red (maximum) in each patient. Right: RI for moving 2 s long windows across the voltage time course. ICD, implantable cardioverter defibrillator; PVT/VF, polymorphic ventricular tachycardia/ventricular fibrillation; RI, regularity index; mean RI in the first 10 s. RV, right ventricle.

