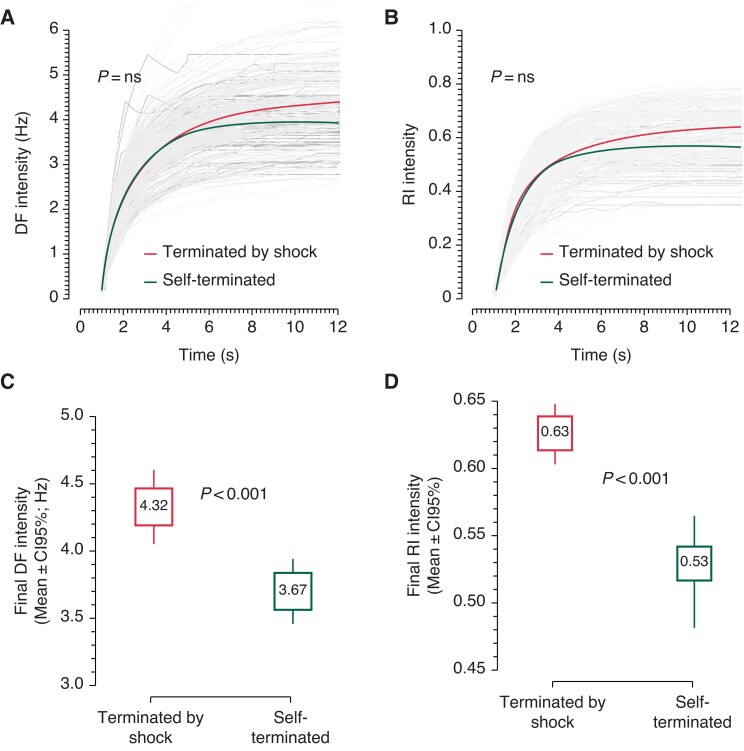
Figure 3.
Cumulative time course analysis of the Intensity of DF and RI during PVT/VF episodes. Panel A and B show time courses of DF and RI intensity for all episodes (grey) with mean time courses for episodes terminated by shock (red) and self-terminated episodes (green). Panels C and D are box plots of the final DF and RI intensity values, respectively, for all shock-terminated episodes (left) and self-terminated episodes (right). DF, dominant frequency; PVT/VF, polymorphic ventricular tachycardia/ventricular fibrillation; RI, regularity index.

